


Introduction
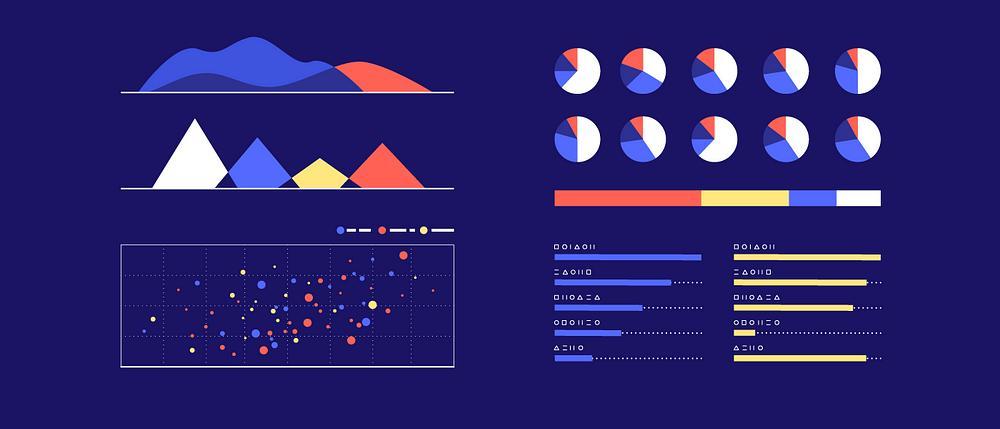
while reading for your exams, you may have been attracted to visual depictions of information. Flowcharts, graphs, and pie charts, are still used for most statistics to give an overview of all the compendium of other boring data. Plus, in the age of the internet, infographics are getting viral like hotcakes. Data visualization refers to the representation of the information through diagrams or pictures.
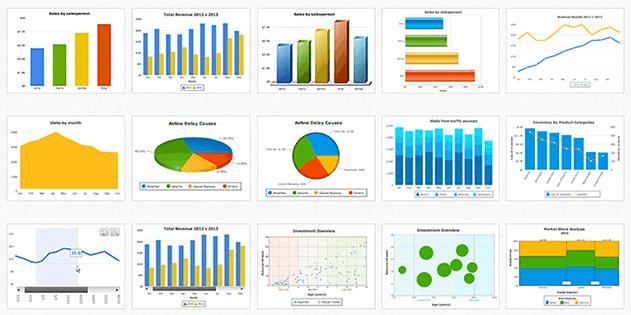
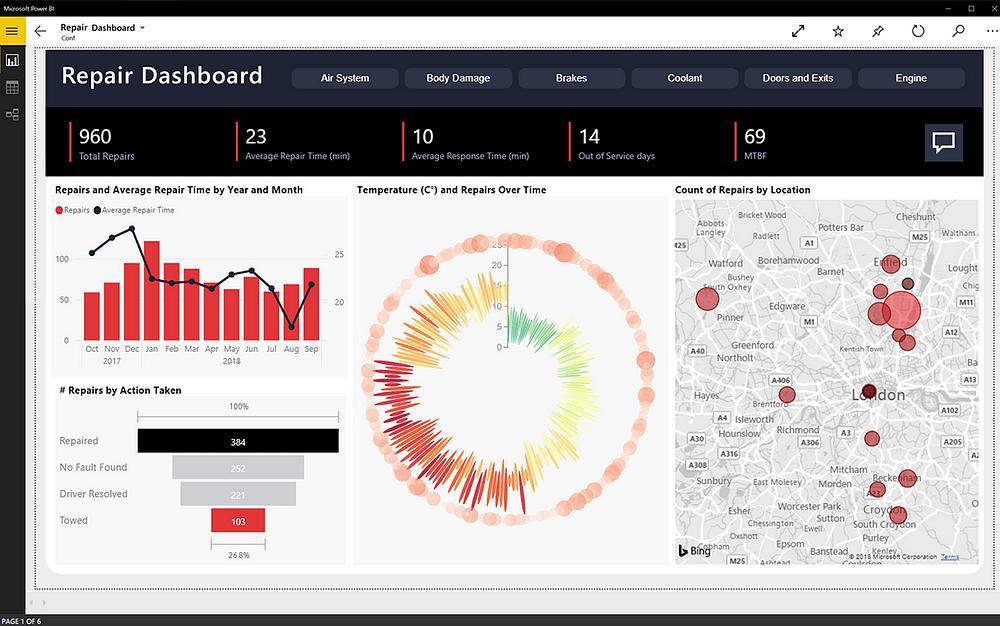
Well, now that we have the definition set aside, how can you make effective data visualization? Of course, you would need some available tools for data visualisation that will help you to design them. A designer cannot work without their tools after all. Here are some of the tools that will help you with your data visualisation process:
1. Datavisual
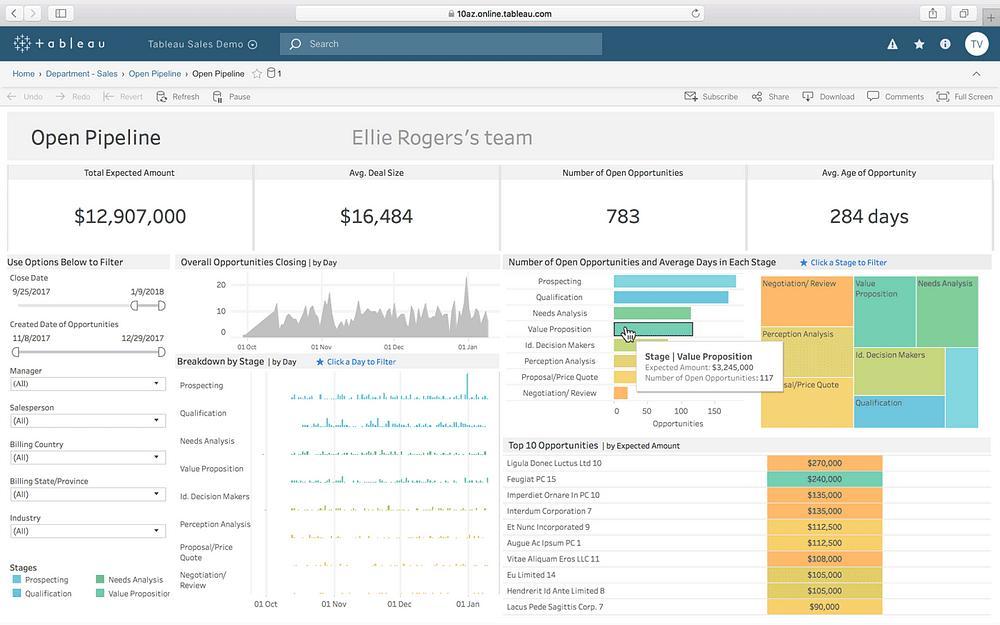
Imagine how difficult it would be to repeatedly format a design when you can just use a pre-set format. DataVisual, which was once private, became public and made the life of designers easier. Format your charts easily and coordinate large amounts of charts without facing any cluttering anxiety.
 daa
daa
 5+ registered

