Do you think IIT Guwahati certified course can help you in your career?
Introduction
An activity diagram in UML (Unified Modeling Language) is a powerful behavioral modeling tool used to represent the dynamic flow of activities within a system or process. These diagrams are widely used in system design, software development, and workflow modeling to visualize how tasks and operations are executed and how control flows from one step to the next.
In this article, we’ll explore the importance of activity diagrams in system design, understand their components, and walk through the process of creating activity diagrams using UML notation.
What is an Activity Diagram?
An activity diagram is a graphical representation that illustrates the flow of control and actions within a system or business process. Each node in the diagram represents an action or activity, while the arrows indicate the direction of flow or sequence of operations.
These activities may include operations like calculations, decisions, or data manipulations. Activity diagrams also incorporate control flow elements such as decision points, forks, joins, and loops to represent more complex and conditional logic.
This makes them especially useful for:
Modeling the behavior of software systems.
Visualizing business processes and workflows.
Handling multiple execution scenarios.
Enhancing clarity and communication between project stakeholders.
Overall, activity diagrams provide a structured and easy-to-understand visualization of processes, helping teams to analyze, optimize, and document system behavior effectively.
Where are Activity Diagrams Used?
Activity diagrams are utilized across multiple industries to model, analyze, and improve processes. Key areas of application include:
Software Development: Used to model software behavior, component interactions, and data flow within systems.
Business Process Modeling: Help analyze organizational workflows and identify areas for improvement or automation.
Workflow Management: Visualize and manage task sequences to ensure proper execution and streamline operations.
Project Management: Aid in planning, tracking progress, and detecting bottlenecks or potential delays in projects.
Education: Simplify the teaching and learning of complex concepts through clear visual representations of processes.
Symbols Used in Activity Diagram
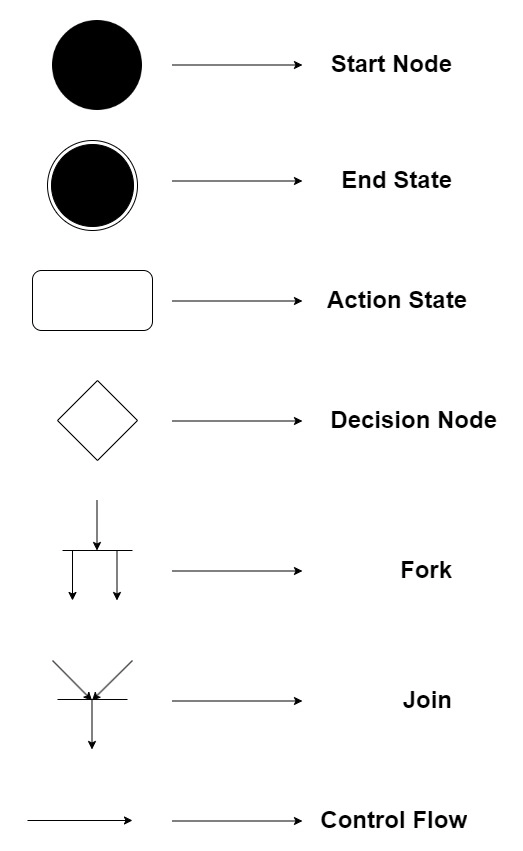
Here are some of the symbols used in an activity diagram:
Start and end symbols: Represent the start and end of a process or activity. They are usually depicted as a circle and can be labeled "Start" and "End," respectively.
Activity symbol: This represents a task or action that needs to be performed as part of the process. It is usually depicted as a rectangle with rounded corners and can be labeled with a brief activity description.
Decision symbol: This represents a decision point in the process where the flow can diverge based on a condition. It is usually depicted as a diamond-shaped box and can be labeled with the question or condition that determines the path of the flow.
Merge symbol: Represents the merging of multiple flows into a single flow. It is usually depicted as an inverted diamond-shaped box.
Fork and join symbols: Represent the forking and joining of multiple flows. The fork symbol is usually depicted as a horizontal bar with multiple arrows pointing downward, while the join symbol is depicted as a horizontal bar with multiple arrows pointing upward.
Object symbol: Represents an object or entity that is involved in the process. It is usually depicted as a rectangle with the name of the object or entity inside.
Swimlane symbol: This represents the roles or actors involved in the process. It is usually depicted as a vertical or horizontal partition with the name of the role or actor inside.
These symbols can be combined in various ways to create an activity diagram that accurately represents the process or system being modeled.
How to create an activity diagram?
Here are the steps to create an activity diagram in a more readable format:
Identify the process: Identify the process or system you want to model using an activity diagram. This could be a business process, a software system, or any other type of process.
List the activities: List the primary activities involved in the process. These are the steps or actions that need to be taken to achieve the process's objective.
Determine inputs and outputs: Identify what inputs and outputs are required for each activity. This helps you understand how each activity is connected to the others.
Sketch the process flow: Create a rough sketch of the process flow using boxes and arrows. Use boxes to represent the activities and arrows to show the flow of control between the activities.
Add decision points: Identify any decision points in the process with multiple possible paths. Use diamond-shaped boxes to represent these decision points and use arrows to connect the possible paths.
Use swimlanes: If multiple actors or roles are involved in the process, use swimlanes to separate them. Swimlanes are vertical or horizontal partitions that help show which activities are associated with which actor or role.
Refine the diagram: Refine the diagram by adding more details and making it easier to read. Use consistent symbols and make sure the diagram is clear and concise.
Validate with stakeholders: Share the diagram with stakeholders and get their feedback to ensure it accurately represents the process or system.
Use a software tool: To create a professional-looking activity diagram, you can use a software tool such as Microsoft Visio, Lucidchart, or Draw.io.
By following these steps, you can create an effective activity diagram that helps you model and analyze complex processes or systems. Remember to keep the diagram simple and easy to understand by using consistent symbols and ensuring it is clear and concise.
Example of Activity Diagram
The following diagram depicts the activity flow for a customer to authenticate their identity before initiating an ATM transaction.
Importance of Activity Diagram in System Design
Activity diagrams are essential in system design and can provide many benefits, including:
Process visualization: Activity diagrams help visualize complex processes or systems by breaking them down into simple steps and activities. This makes it easier to understand how the different parts of the system work together and identify potential improvement areas.
Requirements Analysis: Activity diagrams can be used to analyze system requirements and ensure that all necessary activities and processes are included in the design. They can also help identify redundant or unnecessary steps in the process that can be eliminated to improve efficiency.
Communication: Activity diagrams visually represent the system design that can be easily shared and understood by stakeholders, including developers, designers, and project managers. This can help ensure that everyone involved in the project clearly understands the system design and how it works.
Error Prevention: By breaking down complex processes into simpler steps, activity diagrams can help identify potential errors or problems in the system design before implementation. This can help prevent costly errors and delays during the development process.
Testing and Verification: Activity diagrams can be used to test and verify a system design. Developers can ensure that the system functions as expected and meets all requirements by creating test cases based on the activities and processes outlined in the diagram.
Frequently Asked Questions
How does UML help in modeling complex systems?
UML provides a standardized way to represent and visualize complex systems, making it easier to understand and communicate the system's design and structure.
Can UML be used for non-software applications?
Yes, UML can be used to model non-software systems such as business processes, workflows, and organizational structures.
What is the role of UML in agile software development?
UML can be used in agile software development to facilitate communication between developers, testers, and other stakeholders and to create visual representations of requirements, user stories, and design decisions.
What are the 6 basic elements of an activity diagram?
The six basic elements of an activity diagram are:
Activities – Represent a set of actions or tasks performed in a sequence.
Actions – Single executable steps within an activity.
Action Constraints – Define conditions or rules for actions.
Control Flow – Shows the flow and sequence between actions.
Initial Node – Marks the starting point of the activity.
Final Node – Indicates the end of the activity flow.
What is the difference between a flowchart and an activity diagram?
Flowchart: A basic visual tool showing step-by-step workflows using shapes like rectangles (process), diamonds (decisions), and arrows.
Activity Diagram: A UML-based diagram used in system design to represent sequential and parallel flows, decisions, and roles using activity nodes, control flows, and swimlanes.
Conclusion
Activity diagrams are essential in system design for visualizing workflows, actions, and decision points within a process. By mapping out activities using symbols like arrows, rectangles, and diamonds, they help identify inefficiencies, improve communication, and simplify complex systems.
Commonly used in software development, business modeling, and project management, these diagrams clarify roles and streamline processes. To create one, define the process, list activities, determine inputs/outputs, and use standard UML symbols to structure the flow.
You can also consider our System Design Course to give your career an edge over others.
We sincerely hope that you found this blog informative and beneficial. Please do not hesitate to share your thoughts and feedback in the comments section below.


 9+ registered

