REAL-TIME DATA COLLECTION
An IoT dashboard's primary goal is to offer helpful information in real-time so that damage may be averted. Consider what would happen if an IoT dashboard presenting a weather prediction provided accurate data after changing weather conditions. After the time of occurrence, the data acquired is useless.
As a result, a dashboard must show both historical and current data.
The information presented on the IoT web app screen with reduced latency is accurate time data. The image depicts the dashboard of a car, which displays the current position through GPS tracking.
REAL-TIME ANALYSIS OF IOT DATA
Everything is connected via the Internet in our technological age. On the other hand, the Internet is brimming with data files, including photographs, text, statistics, etc. The question is which data is essential and which data is unnecessary. This is accomplished by examining data and classifying it as either information or data. IoT data analytics analyzes raw data and extracts valuable information from it.
Sensors are used to create IoT devices, using multiple detectors for different metrics. A proximity sensor, for example, detects the distance between two items, while a temperature sensor detects the quantity of heat or cold in the environment. All of this information is saved in the device's cloud storage. The vital data is analyzed by the IoT control panel and transmitted to data visualizations or IoT data charts.
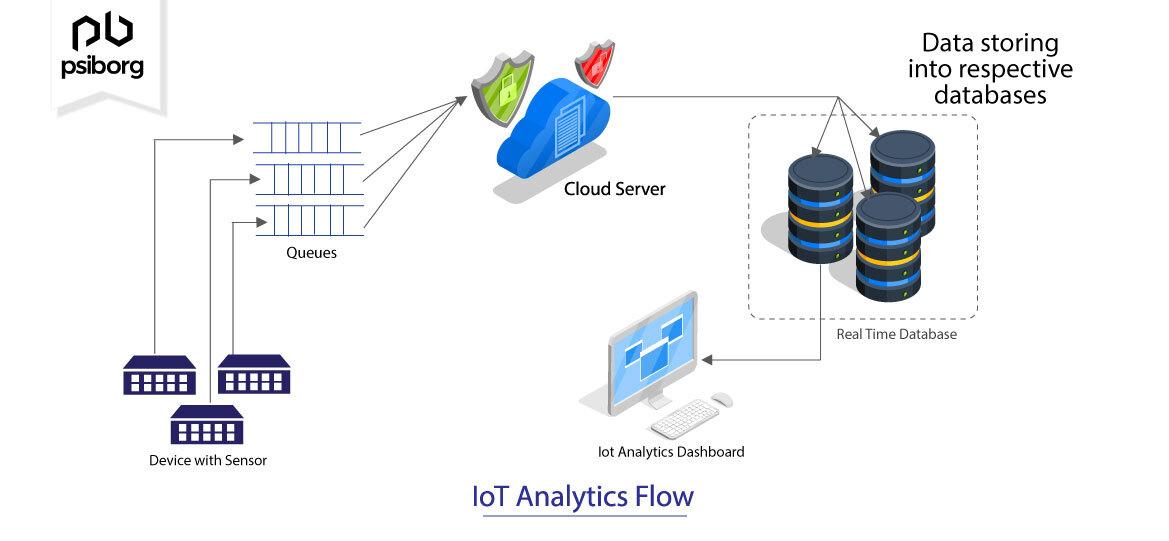
IOT ANALYSIS FLOW
We are aware of IoT analysis now, but how does it work? The flow of IoT analysis is easy to understand with the flow diagram below:
 source
By now, a question arises how does sensor data go from device to cloud?
CLOUD INTEGRATION WITH IOT DEVICES
IoT Gateways are devices that connect the cloud to IoT device nodes or sensor devices. The IoT gateway transmits data calculated at the edge to the cloud for analysis and storage. Data gathered from wireless sensor networks, and other IoT devices will be sent to the cloud via gateways. After then, the data is kept in the cloud. IoT data analytics analyze data in real-time and arrange it into appropriate databases. The data from the database is visualized, and the IoT analysis dashboard creates graphics. The data presented in the pictures provide valuable information that may be understood without becoming lost in the numbers. Mobile phones, desktops, and tablets may all access this information.
DATA MANAGEMENT
Another aspect of an effective IoT dashboard is data management or organization. A dashboard is fully functional in synchronizing data from a cloud-based database and converting it into human-readable visualizations. But how will the user know which information is essential and which is not? This is where the data organizing functionality comes into play. Data should be sorted according to parameters and values in an IoT control panel. According to his needs, the user should be able to emphasize, resize, or export the data presented on the web interface. The term "emphasizing the data" refers to separating the critical data from the rest. If an urgent situation arises that requires immediate attention from the user, but the dashboard customarily displays the information, serious harm may result. As a result, emphasizing the data is critical. This may be accomplished by using animations or different colors to highlight the data, immediately drawing the user's attention.
The user should be able to zoom in or out on intricate details while resizing. Similarly, data should be transportable or exportable to other file formats so that different values may be appropriately seen, compared, and understood.
 source
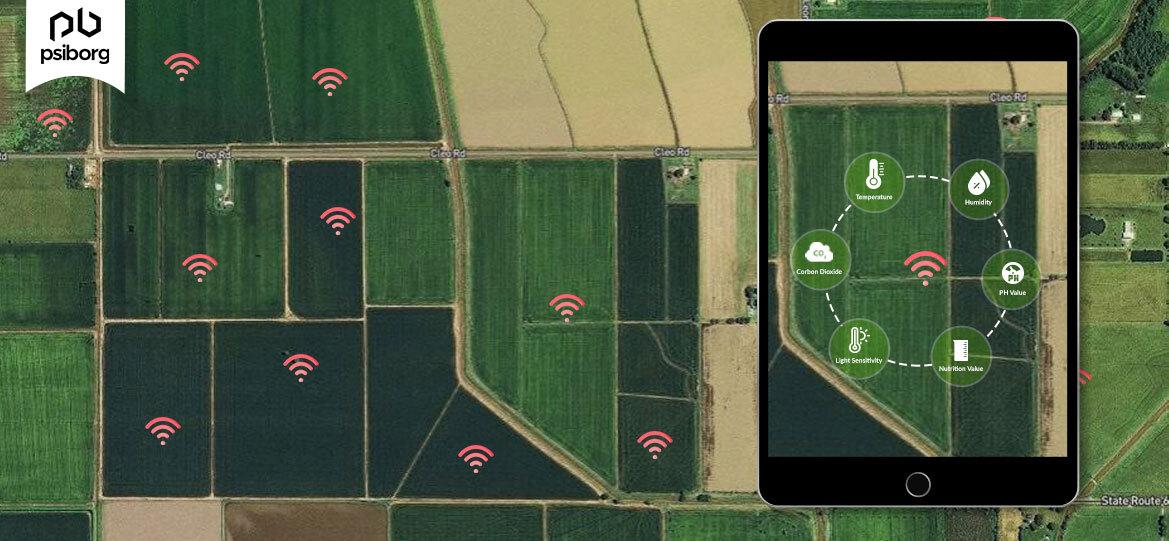
The image depicts an IoT dashboard for a soil quality monitor, with the user being able to click on a specific dot on the land map. The area zooms out as the user clicks on the map, revealing different parameter values for the given location.
DATA VISUALIZATION IN IOT DASHBOARD
A phrase used to characterize the most crucial component of an IoT Dashboard is data visualization. Words are significantly less exact than images. This suggests that visual information helps us remember concepts better than written communication. According to various physiological studies, the human brain can swiftly comprehend and remember graphic material. In basic terms, data visualization displays data in graphs, pictograms, bar charts, pie charts, and other visualizations. The dashboard includes several IoT data visualization tools that map the data in graphical representations. Let's look at how data visualization may help with the IoT Dashboard.
The data gathered by the IoT device is represented via an IoT dashboard. However, the amount of data collected is enormous. As a result, all of the data gathered must be presented visually so that the user can understand it. To put it another way, IoT data visualization is a method of presenting raw data more logically. The dashboard organizes the graphics based on the information that has been analyzed.
Data visualization procedures automate the complete data analysis and decision-making process for enhanced device performance. It also aids in the development of more robust company strategies.
DATA VISUALS IN AN IOT DASHBOARD
These data visualizations are created using a variety of approaches and technologies. The types of data visualization are listed below however they are not exhaustive:
- Graphs
- Histograms
- Pictogram
- Graph with bars
- Temperature Maps
- Gauges
- Statistics
- Line charts
- Maps of locations
- Infographics
- Tables
- Cloud of bubbles
- Graphical forms
- Timeline
- Scatter graph
PARAMETERS WHICH CAN BE REPRESENTED BY DATA VISUALISATION
IoT dashboards are primarily designed to show data received by sensors embedded in IoT devices. The following parameters can be displayed using data:
- Climate conditions
- Temperature
- pH value of moisture level
- Humidity
- Proximity
- Location
- Molecular-level
- Voltage or current
- Different element levels
- Pressure
- The quality of various environments
- Air or water toxicity
- Motion
Temperature, humidity, light sensitivity, pH value, water level, and moisture level are all represented on the IoT web app screen for an agricultural area.
STORAGE OF IOT DATA
Every second, an IoT device creates massive amounts of data. If a device is used to obtain real-time weather information, it will make data for every change in the environment, resulting in a large amount of data over time.
Because smart gadgets have sensors, they cannot store this amount of data. As a result, all of this information is saved in the cloud. Let's look at how the IoT web app stores information.
The data collected by IoT devices is examined in terms of time. The timestamp data is processed and uploaded to the cloud storage of the IoT devices, building a database. The IoT Dashboard takes data from a database and visualizes it for the user.
Only if the IoT Dashboard can load data quickly and develop graphics from the database is it deemed helpful. Some IoT web apps maximize the user experience by linking the data (collected via remotely dispersed intelligent devices) with their database. Other control panels are made to interface with standard databases.
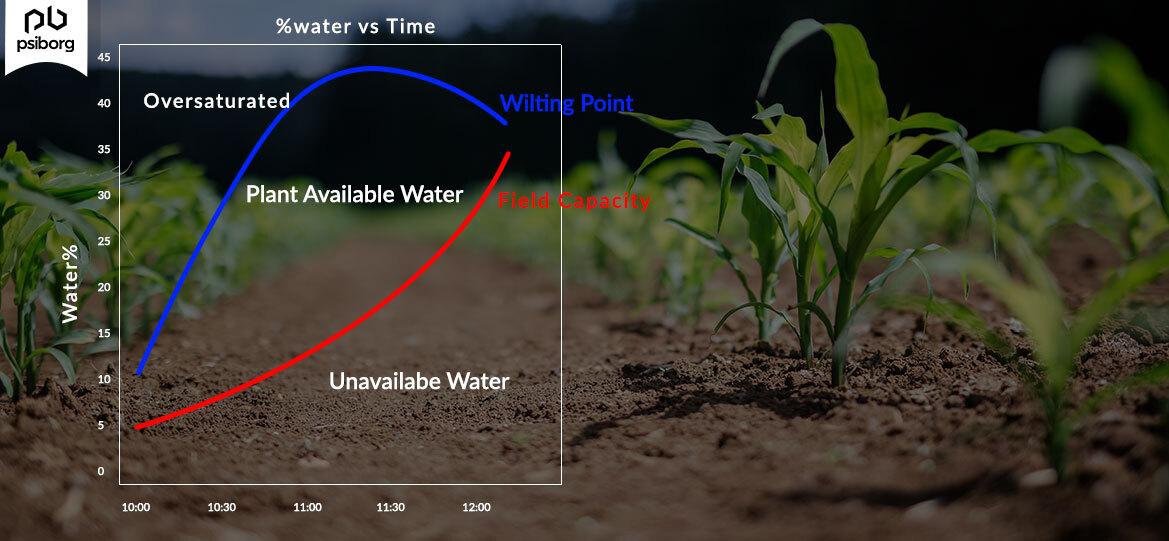
source
The dashboard shown above is linked to a soil quality monitor. It displays a moisture level history to visualize the numbers from the device database whenever the moisture level rises or falls.
USE CASES FOR DATA VISUALIZATION IN IOT DASHBOARD
The information provided above can help you create a successful IoT dashboard. Let's look at some real-world examples of IoT web apps to learn more.
IOT CONTROL PANEL FOR MULTIPLE DEVICES
Data from various devices incorporated into an IoT control panel may be shown. The security status of multiple devices placed in the house will be shown on a home security system dashboard. These gadgets, which contain various sensors, may be mounted floor by floor, on the main gate, in the garden area, etc. The home security dashboard will show real-time security information for all devices. Each sensor on the gadget will provide distinct data, saved and evaluated individually. The user may check statistics for a specific place by clicking on it.
ELECTRICITY CONSUMPTION MONITORING
Electricity consumption monitoring can be implemented in factories, multistory buildings, or offices to determine how much electricity is used on each floor. The dashboard will display power outages, short circuits, wiring problems, and other concerns in real-time. All of these variables may be represented graphically in many ways. The technology can save time and prevent harm from power outages in industries or buildings where every function relies on machinery.
BUSINESS PRODUCTIVITY MANAGEMENT
Making accurate forecasts requires the usage of an effective dashboard. The dashboard may show the production graphs of the company's many departments, which can be used to forecast actions to boost the departments' productivity. This might aid revenue growth as well as business expansion.
PARKING MANAGEMENT SYSTEM
Nowadays, automobile parking is a significant issue since many cars have few parking places. A car parking management system may be placed in the parking lot, and the system's dashboard will deliver real-time information in visual form. The empty parking place can be represented by a green signal, whereas a car symbol can represent the filled parking spacel. The car plate number may also be shown on the IoT control panel, allowing users to find the vehicle and save time quickly.
FOR BOOKING OF TABLES IN A HUGE CAFE OR RESTAURANT
Customers at crowded restaurants may cause a lot of havoc. It might be tough to find a spare table when there are many people in line. The most straightforward approach to avoid such scenarios is to use the restaurant table reservation system. It can include an occupancy sensor placed on the tables to display the number of empty tables in the large café. It will also assist in anticipating which tables will become vacant soon, allowing the owner to make pre-bookings for guests.
TRAFFIC CONTROL SYSTEM
The data obtained from the roadside cameras may be used to regulate and manage traffic. Various visual forms can visualize and show data on the IoT dashboard. It also helps to avoid traffic bottlenecks and road accidents.
SPORTS AND FITNESS
Sports have changed dramatically as a result of IoT technology. With the introduction of IoT technology, sports have become more entertaining for both athletes and spectators. Smart sensors are used in sports to provide a seamless link between athletes, fans/audiences, and sports venues. This information is examined to provide insights into the athletes' vital health information, such as hydration, anxiety, and heat fatigue. This information is highly beneficial to athletes' emotional and physical health and their safety.
ENVIRONMENTAL MONITORING
Environmental monitoring isn't only for a few weeks or months; it might last months, years, or even a lifetime. Environmental monitoring with IoT includes air quality, water quality, landslide detection, and forest fire detection, among other things.
Frequently Asked Questions.
What is visualization in IoT?
IoT Data Visualization is a technique for transforming raw data into a more meaningful representation drawn from many data sources. It analyses data and looks for particular trends and behaviors that help businesses make better decisions. It aids in the development of a viable company plan.
What is analytics in IoT?
The use of data analysis techniques and methods to gain value from the massive amounts of data created by connected Internet of Things devices is known as IoT analytics. IoT analytics' potential is frequently mentioned regarding Industrial IoT.
What is an IoT dashboard?
An IoT dashboard is the user interface of an IoT platform that allows users to monitor and interact with connected devices via graphs, charts, and other UI components.
How is analytics combined with IoT?
In a nutshell, IoT data analytics is analyzing vast amounts of data created by connected devices using intelligent software. It may help businesses streamline operations, engage more customers, automate procedures, and empower staff, among other things.
What are the main parts of the IoT system?
On the other hand, all-comprehensive IoT systems are the same in that they combine four separate components: sensors/devices, connection, data processing, and a user interface.
Conclusion
So that's the end of the article Analytics and Visualization Concept in IoT Analytics.
After reading about the AWS DeepRacer(Race Concept), are you not feeling excited to read/explore more articles on the topic of IoT Analytics? Don't worry; Coding Ninjas has you covered.
Check out this article - Components Of IOT , What is arduino uno
Upskill yourself in Data Structures and Algorithms, Competitive Programming, JavaScript, System Design, and more with our Coding Ninjas Studio Guided Path! You can also consider our Data Analytics Course to give your career an edge over others.
Please vote for our blogs if you find them valuable and exciting.
Happy studying!


 8+ registered

