Do you think IIT Guwahati certified course can help you in your career?
Introduction
Welcome readers! In this blog, we will learn about AWS Cloud Trail. AWS CloudTrail is an AWS service that allows you to manage your AWS account's governance, compliance, operational, and risk auditing. In CloudTrail, actions done by a user, role, or AWS service are recorded as events. Actions made in the AWS Management Console, AWS Command Line Interface, and AWS SDKs and APIs are all considered events.
AWS CloudTrail will only display the results of the CloudTrail Event History for the current region for the previous 90 days and will only support the AWS services listed above. These events are confined to account activity and management events such as create, modify, and delete API requests. Configure a CloudTrail trail to get a complete record of account activity, including all management events, data events, and read-only activity.
Setup
AWS CloudTrail is an AWS service that allows you to manage your AWS account's governance, compliance, risk, and operational auditing. In CloudTrail, actions made by a Principal (User, Role, or AWS Service) are recorded as events.
We will highlight the steps below:
1. Search for the CloudTrail Service under the Management Tools Section in the console and click on CloudTrail.
2. The redesigned CloudTrail console will be the default experience starting the week of August 10, 2020. You'll be able to go back to the previous console if you want. In this workshop, though, we'll be using the new CloudTrail Console.
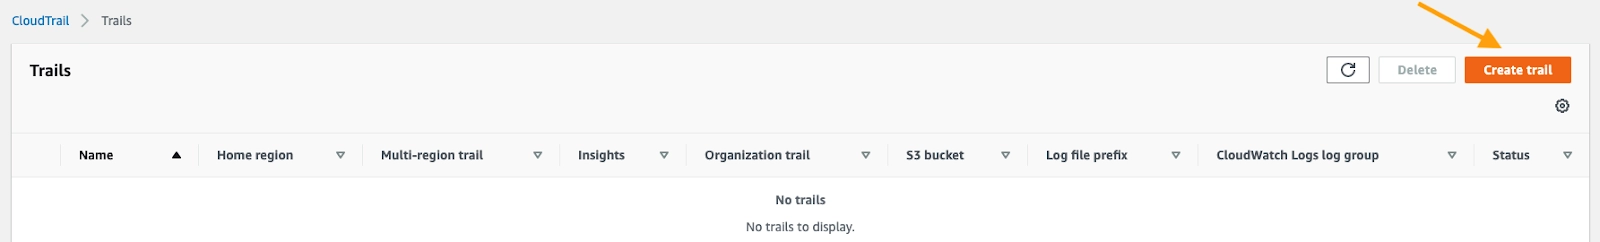
3. Once in the CloudTrail Console, click on Trails on the Left Side of the screen.
4. Then Click on Create Trail to create our trail for this lab.
5. Apply the following settings and create the trail.
Alerting
We'll use Amazon EventBridge in this part to monitor and alert when an IAM policy is applied to an IAM user. The EventBridge Rule created will monitor for a specific event name in CloudTrail, and will use an SNS message to notify regarding an event when it occurs.
1. Go to the Amazon EventBridge console.
2. Once in the EventBridge Console, click on Rules on the Left Side of the screen.
3. Click on the Create rule button.
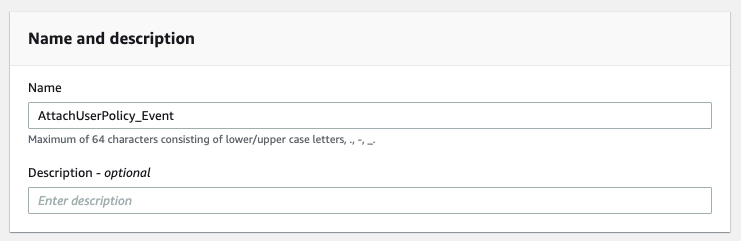
4. Configure the Rule using the following settings:
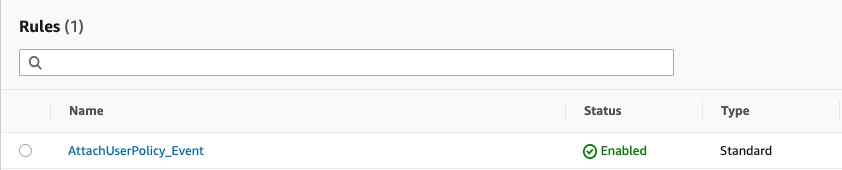
Enter a Name for the rule (e.g. AttachUserPolicy_Event).
Metric filters can be used to keep track of events in a log group as they are reported to CloudWatch Logs. You can track and count individual phrases, or you can extract values from log events and link them to a measure. In this part, we'll manually design a Metric Filter to display CloudTrail's access refused problems.
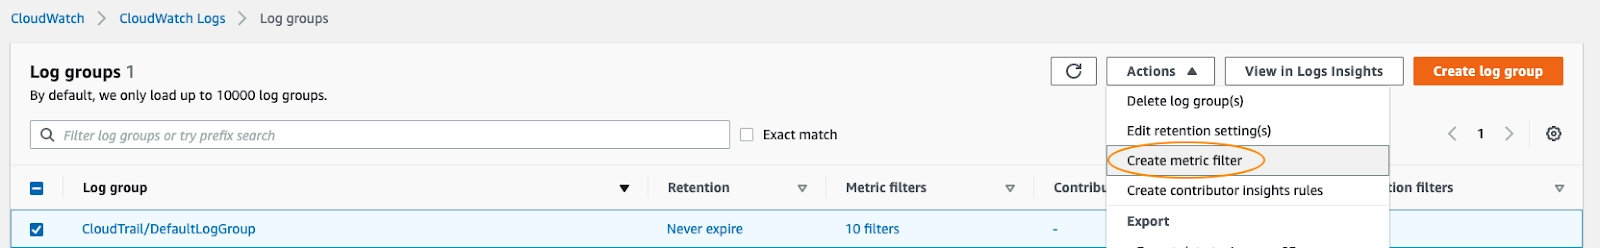
1. Go to the CloudWatch console.
2. Select the CloudTrail Log Group we created in the setup.
3. Once selected, click Actions and Create Metric Filter.
CloudWatch Logs Insights lets you search and examine your log data in Amazon CloudWatch Logs interactively. You can run queries to help you respond to operational concerns more quickly and effectively. You can use CloudWatch Logs Insights to discover potential causes and confirm applied fixes if an issue occurs.
CloudWatch Logs Insights detects fields in logs from AWS services, including Amazon Route 53, AWS Lambda, AWS CloudTrail, and Amazon VPC, as well as any application or custom log that emits JSON log events. In this lab, we'll use Insights to query CloudTrail events and CloudWatch Logs data and add it to a CloudWatch Dashboard.
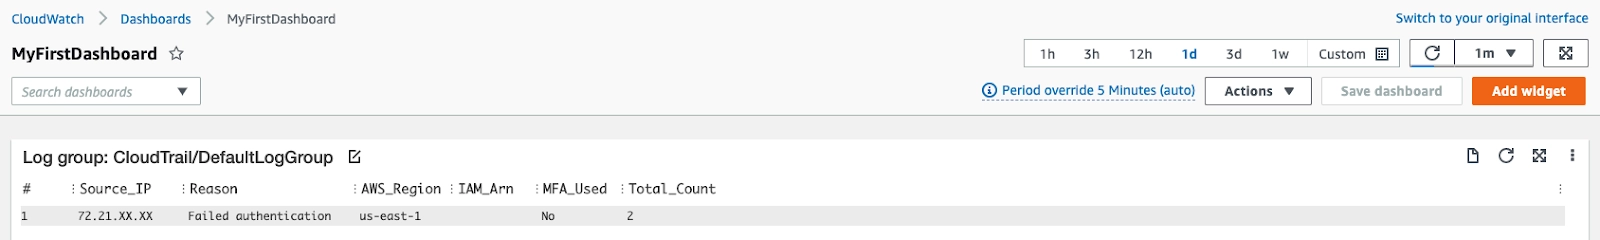
1. Go to the CloudWatch Dashboards
2. Click Create dashboard
Give a dashboard name MyFirstDashboard
Click Create dashboard
3. Select a widget type to configure: Logs table (Explore results from Logs Insights) and click Next
4. From the drop-down, select the CloudWatch Log Group created during the setup.
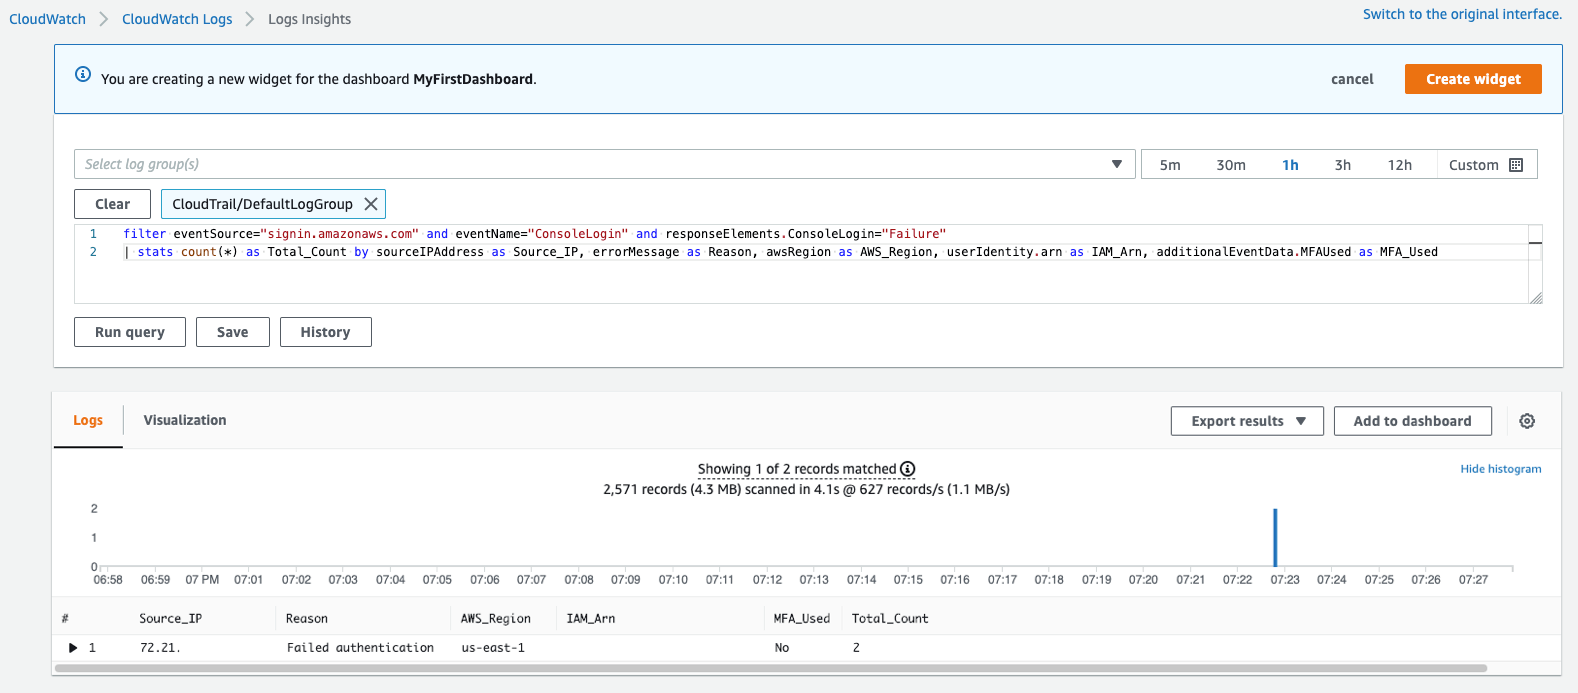
5. In the query pane, enter the following query, which filters failed SignIn attempts to the AWS Account and also captures if MFA was used or not.
filter eventSource="signin.amazonaws.com" and eventName="ConsoleLogin" and responseElements.ConsoleLogin="Failure" | stats count(*) as Total_Count by sourceIPAddress as Source_IP, errorMessage as Reason, awsRegion as AWS_Region, userIdentity.arn as IAM_Arn, additionalEventData.MFAUsed as MFA_Used
Using Athena and CloudTrail logs to analyse AWS service activity is a fantastic method to improve your analysis. You can, for example, utilize queries to spot trends and further isolate activity based on attributes like source IP address or user.
1. To get started, go to the S3 Console.
Click Create bucket button
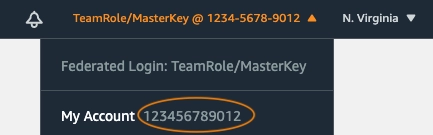
Find your accountid at the top right corner of the screen
Enter a Bucket name such as aws-athena-query-results-accountid-us-east-1 (replace accountid with yours)
Click Create bucket and leave the rest of the settings alone.
2. Go to the Athena Console
To begin, select Get Started.
In the top right corner of the screen, select Settings.
Enter Query result location with your S3 bucket such as s3://aws-athena-query-results-accountid-us-east-1/ (replace accountid with yours)
Leave everything else as it is and click Save.
3. Go to the CloudTrail Event History Console
Click on Create Athena Table
Choose Storage location from the dropdown: aws-cloudtrail-logs-accountid-hash
Click on Create table
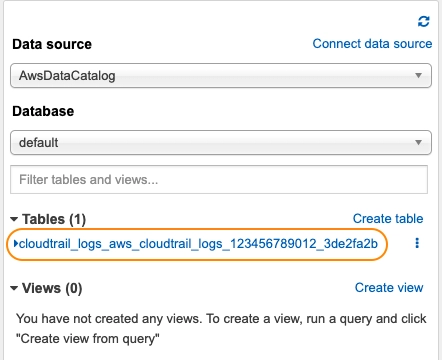
4. Go back to the Athena Console
Choose default Database on the left to show the Athena Table Name.
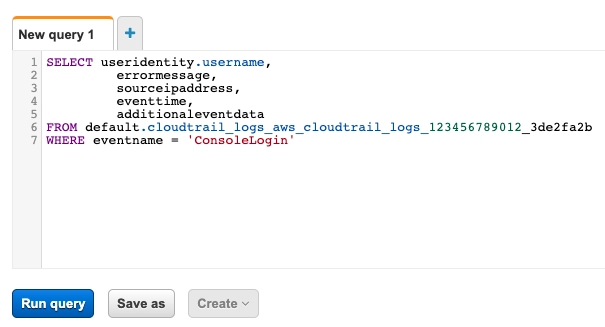
Copy the table and substitute it with the TABLE_NAME in the following queries and click on Run Query.
Source: AWS 5. Console sign-in activity: Auditing your login activity is critical, whether it's to fulfill a compliance standard like PCI, adhere to a best practice security framework like NIST, or simply to better understand who is accessing your assets. The following query gives information such as the user's name, IP address, time of day, if the login was made using the mobile console, and whether multi-factor authentication was utilized.
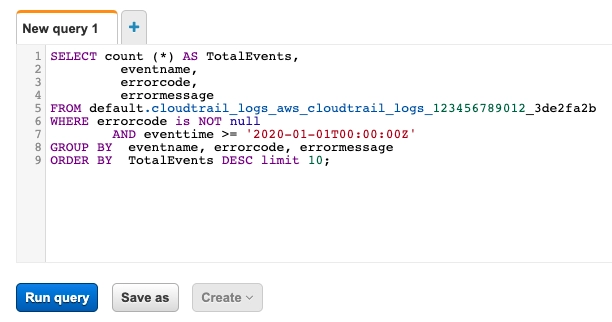
6. AWS event errors: Recurring error messages may indicate a misconfigured policy, erroneous permissions provided to an application, or an unidentified change in your workloads. The following query displays the top ten errors since the beginning of the year.
AWS CloudTrail is an AWS service that allows you to manage your AWS account's governance, compliance, operational, and risk auditing. In CloudTrail, actions done by a user, role, or AWS service are recorded as events.
How does CloudTrail work?
CloudTrail records activities taken by the user directly or by an AWS service on their behalf. An AWS CloudFormation CreateStack call, for example, may result in subsequent API calls to Amazon EC2, Amazon RDS, Amazon EBS, or other services as needed by the AWS CloudFormation template.
What are the benefits of CloudTrail?
CloudTrail enables you to demonstrate compliance, strengthen your security posture, and consolidate activity data across regions and accounts. By documenting actions made on your account, CloudTrail gives visibility into user activity.
What is the difference between AWS config and CloudTrail?
Config focuses on the configuration of your AWS resources and provides detailed snapshots of how they've changed. CloudTrail focuses on the events that cause those changes, such as API calls. It focuses on the user, the program, and the system activity.
Conclusion
In this article, we have extensively discussed the AWS Cloud Trail service that allows you to manage your AWS account's governance, compliance, operational, and risk auditing. In CloudTrail, actions done by a user, role, or AWS service are recorded as events.
We hope that this blog has helped you enhance your knowledge regarding AWS Cloud Trail. Do upvote our blog to help other ninjas grow.


 9+ registered

