Do you think IIT Guwahati certified course can help you in your career?
Introduction
Collecting and preparing data is the first step for training a machine learning model. AWS Data Wrangler speeds up this tedious process from a single visual interface.
In this article, you will learn about the features and use cases of AWS Data Wrangler. You will also learn to import data into Amazon SageMaker and use Data Wrangler to perform transformations and analysis.
Let’s get started.
What is AWS Data Wrangler?
AWS Data Wrangler is a part of Amazon Sagemaker Studio. It is a visual no-code tool that allows you to select, cleanse, explore, visualize, and process your dataset. It contains over 300 built-in data transformations, which ensures you can quickly transform data without writing any code.
Let’s take a look at some features of AWS Data Wrangler.
Features of AWS Data Wrangler
The following are some features of AWS Data Wrangler:-
Fast Data Queries
The data selection tool in AWS Data Wrangler can be used for quickly accessing and selecting tabular or image data from different data sources such as AWS S3, Amazon Redshift, Snowflake, etc.
Data Quality Report
Data Wrangler provides a data quality report that can automatically detect missing values, duplicate rows, and other anomalies such as class imbalance, outliers, etc.
Data Visualization
You can apply different preconfigured visualizations to your data, such as histograms, scatter plots, bar charts, etc. Data wrangler also supports ML-specific visualizations such as bias reports, feature correlations, and time series.
Efficient Data Transformation
Data Wrangler supports 300+ prebuilt data transformations, which allows you to transform your tabular or image dataset without writing a single line of code. You can flatten JSON files, delete duplicate rows, resize images, drop corrupted images, and more.
In the following sections, you will learn how to import the Titanic sample dataset and perform different transformations and analyses on that dataset.
Importing Sample Dataset
Following are the steps to import the Titanic sample dataset:-
Step 1: Open SageMaker Studio and click on “Import & prepare data visually”
Step 2: Click on “Use sample data”
Step 3: Wait for the import to complete
Now that you have imported the sample dataset, we can generate the quality report.
Generating Quality Report in Data Wrangler
The following are the steps for generating the quality report:-
Step 1: Click on the plus next to data types and then select “Add analysis”
Step 2: From the analysis dropdown, choose “Data Quality and Insights Report” and click on run
Result:
The image above shows a summary of the report. Detailed information can be found by scrolling below it.
In the next sections, we will transform the dataset and generate a histogram.
Applying Filter Transform
Now, we will transform the dataset by filtering based on the survived column.
Step 1: Click on the plus next to data types and then select “Add analysis”
Step 2: Click on “Add step”
Step 3: In the dropdown, select “Filter data”
Step 4: Click on the plus button
Step 5: Set “survived” as the column name, condition as “=” and set the value as 1. Click on add to perform the filtering.
The resulting table will only contain the records of those people who survived the crash.
Now, we will generate a histogram from the filtered table.
Histogram Visualization
Now we will generate a histogram from the transformed table.
Step 1: Click on the plus icon next to the filtered data, and then select “Add analysis”
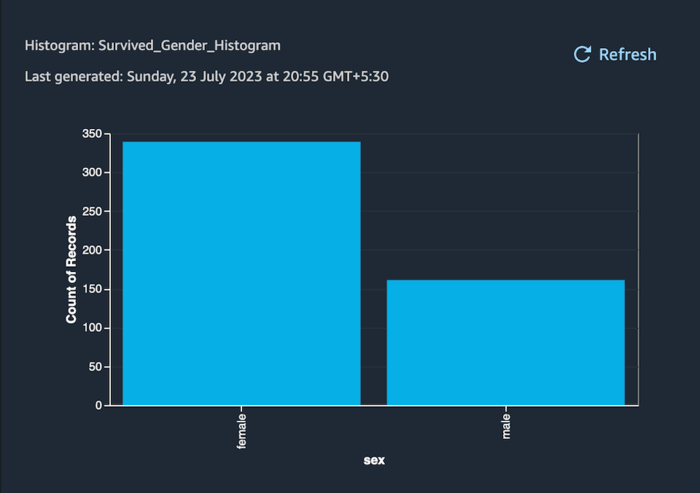
Step 2: Set the analysis type to Histogram, pick sex as the x-axis value, and click on the run button.
Result:
The histogram above represents the total number of survivors from each gender.
Frequently Asked Questions
What is Amazon SageMaker?
Amazon SageMaker is a cloud-based ML platform used for building, training, and deploying machine learning models at scale. It offers a wide set of tools and services to speed up your ML workflow.
What is AWS S3?
AWS S3 stands for Simple Storage Service, which is used for storing large amounts of data such as files, images, videos, and other structured or unstructured data. It is highly scalable, which means you can store virtually unlimited amounts of data.
What is feature correlation?
Feature correlation is the statistical relationship between different attributes in a dataset. It is commonly measured with the Pearson correlation coefficient, which quantifies the linear relationship between two continuous variables from -1 to 1.
Conclusion
In summary, AWS Data Wrangler is a visual tool that speeds up the necessary data pre-processing tasks before training a machine learning model. You learned about some features of Data Wrangler and applied them to a sample data set.
You can go through the following articles to learn more about AWS:-


 8+ registered

