Implementation
#importing the essential modules

from sklearn import svm
from sklearn import datasets

# Loading iris datasets

iris = datasets.load_iris()

# let's print the type of the iris
print(type(iris))

<class 'sklearn.utils.Bunch'>

#The datatype of the iris is 'Bunch .'This Bunch contains the iris datasets and all the attributes.
#One of the attributes is 'data.' 'data' contains all the specifications of the iris datasets.

print(iris.data)


Output:
[[5.2 3.9 1.2 0.2]
[4.9 3.1  2.4 0.1]
[4.7 3.0 1.3 0.2]
[4.9 3.1 2.5 0.2]
[5.1  3.7 1.2 0.2]
[5.4 3.8 1.7 0.3]

#As we can see, four columns are denoting, Sepal Length, Sepal Width, Petal Length, and Petal width
# Let's get the feature names

print(iris.feature_names)


Output:
['sepal length (cm)', 'sepal width (cm)', 'petal length (cm)', 'petal width (cm)']

# There is one more attribute called 'Target .'Target is what we are going to predict

print(iris.target)


Output:
[0 0 0 0 0 0 0 0 0 0 0 0 0 0 0 0 0 0 0 0 0 0 0 0 0 0 0 0 0 0 0 0 0 0 0 0 0
0 0 0 0 0 0 0 0 0 0 0 0 0 1 1 1 1 1 1 1 1 1 1 1 1 1 1 1 1 1 1 1 1 1 1 1 1
1 1 1 1 1 1 1 1 1 1 1 1 1 1 1 1 1 1 1 1 1 1 1 1 1 1 2 2 2 2 2 2 2 2 2 2 2
2 2 2 2 2 2 2 2 2 2 2 2 2 2 2 2 2 2 2 2 2 2 2 2 2 2 2 2 2 2 2 2 2 2 2 2 2
2 2]

# 0 denotes setosa, 1 denotes versicolor, and 2 represents virginica


print(iris.target_names)


Output:
['setosa' 'versicolor' 'virginica']

# Create different arrays for storing the Dependent and Independent variables

X = iris.data
Y = iris.target

# splitting the datasets into train data and test data
from sklearn.model_selection import train_test_split

X_train, X_test, Y_train, Y_test = train_test_split(X,Y,test_size=0.2, random_state=4)

# Now we need to use SVM to build a classifier which helps to classify whenever we provide new data.

model= svm.SVC(kernel = 'linear')

# We have to fit our model and pass in the parameters independent variable,i.e., X_train and the dependent variable Y-train

model.fit(X_train, Y_train)

# The model is ready with us and we can predict the class based on the test dataset

accuracy = model.score(X_test, Y_test)
print(accuracy)


Output:
0.9666666666666667

# The accuracy score is 96%.

Y_predicted = model.predict(X_test)
print('The predicted values are',Y_predicted)
print('The actual values are',Y_test)


Output:
The predicted values are [2 0 2 2 2 1 2 0 0 2 0 0 0 1 2 0 1 0 0 2 0 2 1 0 0 0 0 0 0 2]
The actual values are [2 0 2 2 2 1 1 0 0 2 0 0 0 1 2 0 1 0 0 2 0 2 1 0 0 0 0 0 0 2]
Features of Scikit-learn
- Supervised Learning Algorithms
- Unsupervised Learning Algorithms
- Model Selection and Evaluation
- Data Preprocessing
- Feature Selection
- Ensemble Methods
- Dataset Transformations
- Pipeline Creation
- Model Persistence
- Computation Efficiency
Benefits of using Scikit-learn Libraries
- Consistent API
- Well-documented
- Community Support
- Integration with Scientific Python Stack
- Production-ready
- Extensibility
- Open Source
- Cross-validated Estimates
- Automatic Parameter Tuning
- Scalability
- Reproducibility
- Interoperability
Here are the main ways the Scikit-learn library is used.
Classification: The classification tools identify the category associated with the provided data. For example, classifying images and texts on social media platforms whether they are appropriate or not, they can be used to categorise email messages as either spam or not.
Classification algorithms in Scikit-learn include:
- Support vector machines (SVMs)
- Nearest neighbours
- Random forest
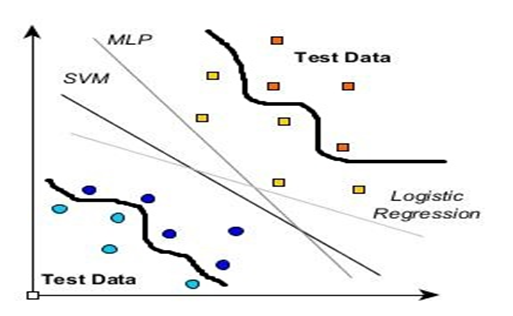
The most famous model used in classification is SVM as it finds the best-suited path for the classification model. If You want to work on the model of SVM here is the official link for the support vector machine. The below graph shows the difference between a simple classifier and SVM. It finds the best possible classifying line for the data.
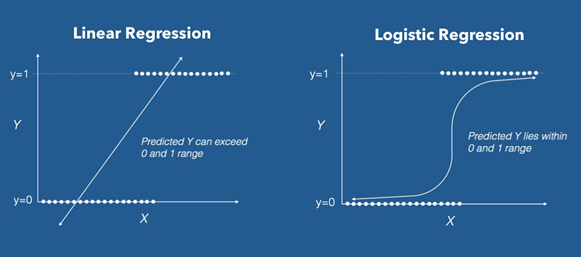
Regression: It involves creating a model that tries to comprehend the relationship between input and output data. Regression models have a tendency to bend their curves for a better approach for problem-solving. For example, regression tools can be used to understand the behaviour of stock prices.
Regression algorithms include:
- SVMs
- Ridge regression
- Lasso
Lasso regression is a type of linear regression that uses shrinkage. Shrinkage is where data values are shrunk towards a central point, like the mean. The lasso procedure encourages simple, sparse models (i.e. models with fewer parameters). Lasso is considered as important model for the regression problems. The graph for the regression models is below and the official link is here.
Clustering: The Scikit-learn clustering tools are used to automatically group data with the same characteristics into sets. Classifying groups in data models are basically something that clustering deals with, for example, customer data can be segmented based on their localities.
Clustering algorithms include:
- K-means
- Spectral clustering
- Mean-shift
Let’s explore K-Means
Clustering is a Machine Learning technique that involves the grouping of data points. Given a set of data points, we can use a clustering algorithm to classify each data point into a specific group.
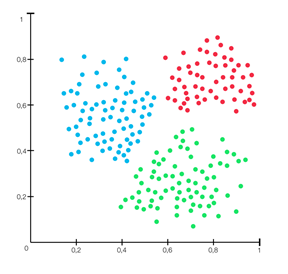
The above graph shows three clusters of separate data with specific properties K-means is a scikit module that takes raw input of the mathematical form of data and binds them in clusters. It is basically a type of unsupervised learning method. An unsupervised learning method is a method in which we draw references from datasets consisting of input data without labelled responses. Generally, it is used as a process to find meaningful structure, explanatory underlying processes, generative features and groupings inherent in a set of examples.
Clustering is the task of dividing the population or data points into a number of groups such that data points in the same groups are more similar to other data points in the same group and dissimilar to the data points in other groups. It is basically a collection of objects on the basis of similarity and dissimilarity between them.
Dimensional Reduction: It lowers the number of random variables for analysis. For example, to increase the efficiency of visualisations, outlying data may not be considered.
Dimensionality reduction algorithms include:
- Missing Values Ratio
- Low Variance Filter
- High Correlation Filter
- Random Forests/Ensemble Trees
- Principal Component Analysis (PCA)
- Backward Feature Elimination
- Forward Feature Construction
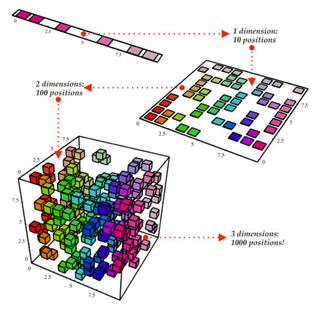
The number of input variables or features for a dataset is referred to as its dimensionality. Dimensionality reduction refers to techniques that reduce the number of input variables in a dataset. More input features often make a predictive modelling task more challenging to model, more generally referred to as the curse of dimensionality.
High-dimensionality statistics and dimensionality reduction techniques are often used for data visualisation. Nevertheless, these techniques can be used in applied machine learning to simplify a classification or regression dataset in order to better fit a predictive model.
Dimension reduction is generally performed to keep the important information only and curve the memory use for the dataset.
Model selection Tools: Model selection algorithms offer tools to compare, validate, and select the best parameters and models to use in your data science projects. Model selection modules that can deliver enhanced accuracy through parameter tuning include:
- Grid search
- Cross-validation
- Metrics
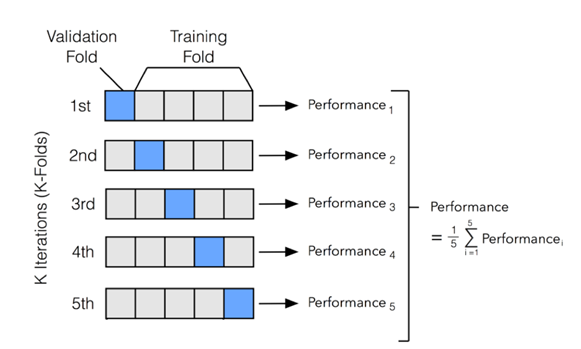
- K-fold
We can’t perform every machine learning algorithm on the same model as the data differs the need to change the model also comes into action so we take the help of the sklearn model selection tools, for example, I take Cross-validation module using this module we break the train data into segments and try to perform the classifier defined on the data and it gives the score for the fragments by this you can easily get an idea of how good your model is performing. Below is the flowchart explanation for K-fold.
Preprocessing: The Scikit-learn preprocessing tools are important in feature extraction and normalisation during data analysis. For example, you can use these tools to transform input data—such as text—and apply their features in your analysis.
Preprocessing modules include:
- Preprocessing
- Feature extraction
- Scaling of data
- Dealing with outliers
- Data Exploration (EDA)
If there is much irrelevant and redundant information present or noisy and unreliable data, then knowledge discovery during the training phase is more difficult. Data preparation and filtering steps can take a considerable amount of processing time. Data preprocessing includes cleaning, Instance selection, normalization, transformation, feature extraction and selection, etc. The product of data preprocessing is the final training set.
Frequently Asked Questions
What is the transform method in Scikit-learn?
The transform method in Scikit-learn is used to apply a fitted transformation to new data. It converts data into a desired format, such as scaling features or reducing dimensions, without modifying the original data.
What is the fit_transform method in Scikit-learn?
The fit_transform method in Scikit-learn combines the fit and transform processes. It first learns the parameters from the training data and then applies the transformation, returning the modified data. This method is useful for streamlining preprocessing steps.
What is the fit method used in Scikit-learn?
The fit method in Scikit-learn is used to learn the parameters of a model or transformation from the training data. It computes necessary statistics or model coefficients, preparing the model for subsequent predictions or transformations.
What are the cons of using Scikit-learn?
- Scikit-learn is not very optimized in graph algorithm
- Scikit-learn is not very good at string processing
- Scikit-learn does not have a solid linear algebra library
Conclusion
In this article, we have discussed the Basic Guide to Scikit-learn. Scikit-learn is an invaluable tool for anyone venturing into the realm of machine learning. Its user-friendly interface, extensive documentation, and comprehensive library of algorithms make it accessible for both beginners and seasoned practitioners. By understanding the fundamental components such as the fit, transform, and fit_transform methods, users can effectively preprocess data, build models, and evaluate their performance.


 8+ registered

