Introduction
We know that the current technology or living society purely depends on Data. Data is everything. There is a large amount of data generated in the present day. But what is important is to analyze this Data to acquire useful insights that develop one’s business. For analyzing data, there are so many tools, and concepts developed. But a new concept called Big Data comes into the picture to support data processing in a handy way. According to Google’s dictionary, Big Data is defined as a collection of extremely large data sets that may be analyzed to reveal patterns computationally that develop one’s business. They are also referred to as too complex and large to be dealt with by traditional data processing applications. We will explore this concept in detail through this blog.
Big Data Analytics
Talking about why Big Data? We have said that Big Data is a collection of large data sets that are hard to analyze using traditional data processing techniques. But analyzing this Big Data gives you so many insights to develop your company. Mainly Google, Amazon, Facebook (Meta), etc., are a way good in this Big Data Analytics.
In some cases, If you have lots of options, you need to select among them may be much more difficult. So It is much important to select what you are interested in, like what problem you are trying to solve by analyzing this Big Data. You can do lots of things by utilizing this much data, but analyzing and getting valuable insights that develop your business and organization is important.
If you are eager to learn Data Analytics, You can also consider our Data Analytics Course to give your career an edge over others.
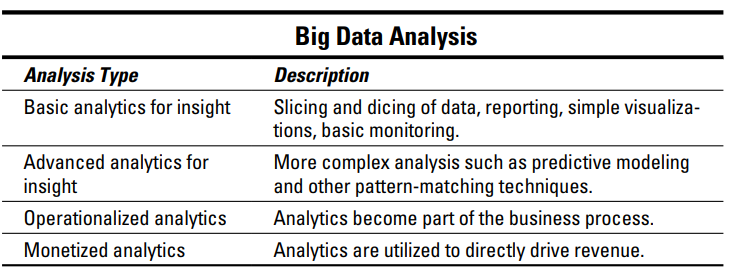
Types of Analysis

Source
Basic Analytics for insight
Let’s talk about the first and simple Basic Analytics to get valuable insights. This type of analysis is done when you are trying to explore the data set and when you have disparate data. Since we are just exploring the data, so simple visualization and some statistics will complete this task. Some of the popular and useful techniques include in this type of analysis are:
Slicing and Dicing
This technique is simple and well understandable. The main idea here is that we have two steps to take. The first is slicing - it involves breaking or dividing the data sets. And the step includes dicing - this involves selecting the columns of the data sets for analysis. For example, if we have a dataset, slicing will get us the data set into columns, and dicing will give us any specific number of columns to make visualization. Example selecting col1 vs col2 or col1 vs col5, etc. After this, we can get a brief idea of which columns of the dataset give us more useful insights according to the problem we are trying to solve.
Basic Monitoring
Basic Monitoring is yet another simple mechanism in which you need to monitor your data from time to time to update your results. For example, if we have time-sensitive data like social media ad campaigns etc. We need to monitor the data time-to-time to update our results.
Anomaly Identification
Anomaly identification involves identifying anomalies (odd things), the things that differ from actual or normal things. For example, suppose we have a company in which something faulty is going on. In that case, anomaly identification involves finding the person or the thing that is making more impact causing this fault.
Advanced Analytics for insight
Advanced Analytics involves complex analysis by using some useful algorithms. This includes techniques such as statistical modeling, neural networks, machine learning, and data mining. These techniques are currently used on demand.
Predictive Modeling
- One of the most popular Advanced Analytics techniques.
- Suitable for both structured and unstructured data.
- Uses Big Data infrastructure (optional) to create predictive models according to the problem definition.
- Example: Like in the case of anomaly detection example, we need to create a predictive model to predict the person or thing that is showing more faulty behaviour.
Text Analytics
- Process of analyzing unstructured data, acquiring relevant information, and converting it into structured data.
- Became an important part of the Big Data Ecosystem.
- Uses the advantages of computational linguistics, statistical terms, and other computer science techniques.
- Example: Social Media Analytics.
Other data mining algorithms
Advanced analytics also involves clustering, advanced forecasting, affinity analysis, etc.
Operationalized Analytics
To make the analytics process as a part of your business, you need to operationalize the analytics. Example: On seeing the previous example, we need to operationalize the built predictive model to the further departments to operate and deploy it in your company rules and regulations.
Monetized Analytics
Analytics can be used to optimize your business to create better decisions and drive bottom- and top-line revenue. However, big data analytics can also be used to derive revenue above and beyond the insights it provides just for your own department or company. You might be able to assemble a unique data set that is valuable to other companies, as well.
For example, credit card providers take the data they assemble to offer value-added analytics products.


