Do you think IIT Guwahati certified course can help you in your career?
Introduction
Capturing Request Data is a very important tool for API Development and Testing. If HTTP Traffic capturing is enabled in Postman, you have the permit to inspect the requests moving between client applications and your API.
These inspections can be saved altogether in a collection. The saved information can be used to understand the behavior of your API and provide some assistance while the debugging process takes place. There are two ways to capture HTTP and HTTPS traffic, which will be discussed in the blog further.
Request Parameters
Request Parameterization is one of the most commonly used features of Postman. Despite creating the same requests with different data, you can just use variables with the required parameters. The data can be from any data file or some environment variable. Parameterization is used specifically for avoiding repetitions of the same tests and iterations and, thus, are used for automation testing.
The parameters are created using double curly braces on both sides of the variable names. An example of how parameters are created is mentioned below:
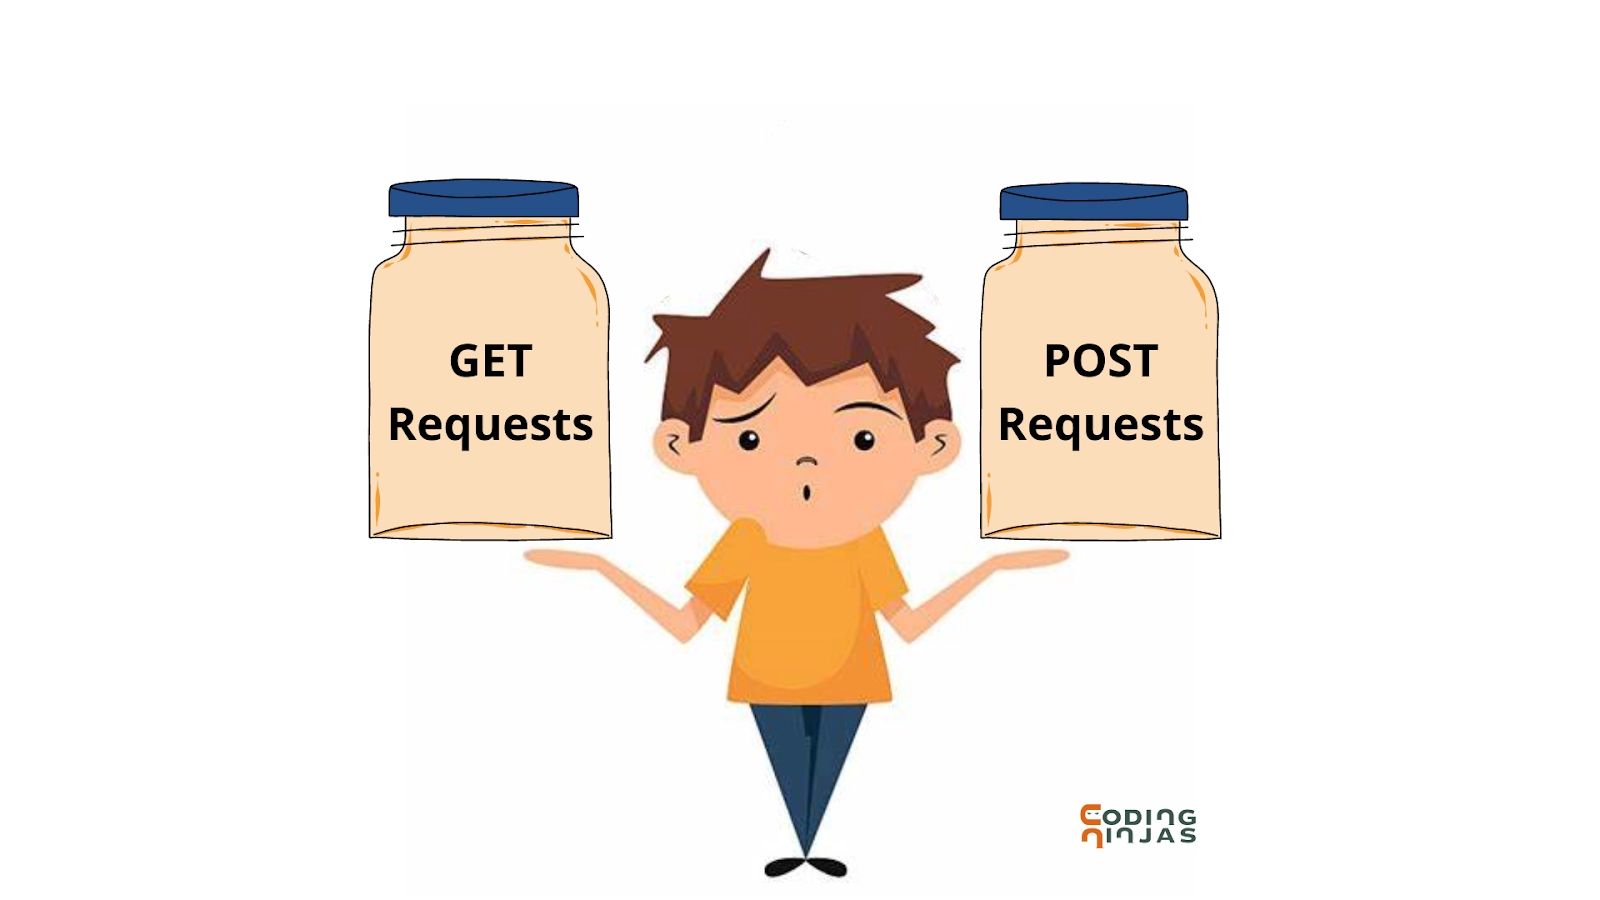
As the name suggests, a GET Request can be used to retrieve the server’s information. You can request any information needed from the server. A GET Request gets all its information from the URL. Also, it does not have any side effects on the server. By side effects, we mean there will be no updation, deletion, or addition of data on the server when you make such a request. There will be no changes at the endpoint.
Follow the steps below to learn how to work with the GET Requests.
In your workspace, set the HTTP Request to GET.
Input the link in the request URL field.
Click on Send to send the request.
If everything is working well, you will surely see 200 OK message.
Now, check if there are 10 user results in the body or not. These 10 user results indicate that the test has run successfully.
POST Requests
A POST Request is very similar to a GET Request with a single difference. As the name indicates, a POST Request is used to specify that a client is posting data on the given endpoint. It is a method used, especially when some extra information needs to be added inside request’s body. Unlike GET Request, there are some side effects on the server.
By side effects, we mean there will be updation, deletion, or addition of data on the server when you make such a request. That means data manipulation is involved in the data the user receives at the endpoint.
To learn how to work with the GET Requests, follow the steps below.
In your workspace, set the HTTP Request to POST.
Input the link in the request URL field.
Now, switch to the Body Tab. In that tab, Click on raw and then select JSON.
After this, copy and paste just one user result from the previous get request and click Next.
Click on Send to send the request.
If everything is working well, you will surely see 201 Created Message.
Also, the posted data will show up in the body.
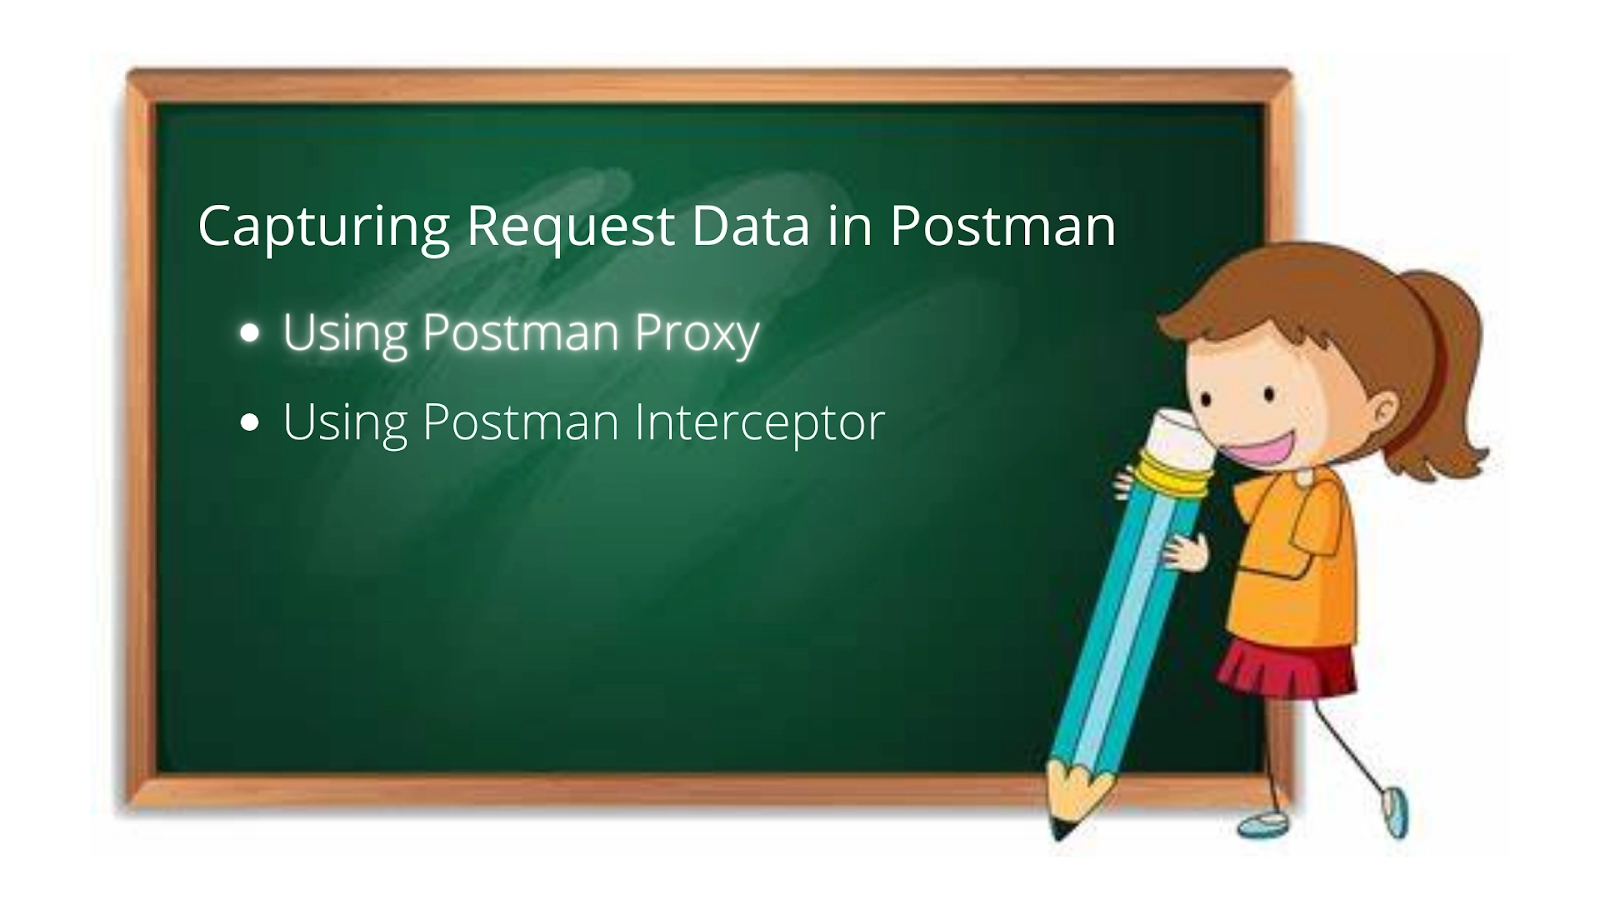
Capturing Request data in Postman
We have already learned that there are two ways in which you can capture traffic in Postman. These are by using the Postman Proxy or by using the Postman Interceptor. To start capturing request data or traffic, you are required to first start the Proxy or Interceptor. After that, you can begin with your debug session. By session, we mean a specific time frame during which you want to capture traffic.
After you are done with your debug session, you have the option to pause and resume capturing or clear the captured traffic without ceasing the work of Proxy or Interceptor. This was a generalized explanation for both of the available options. We will discuss these options separately ahead.
Using Postman Proxy
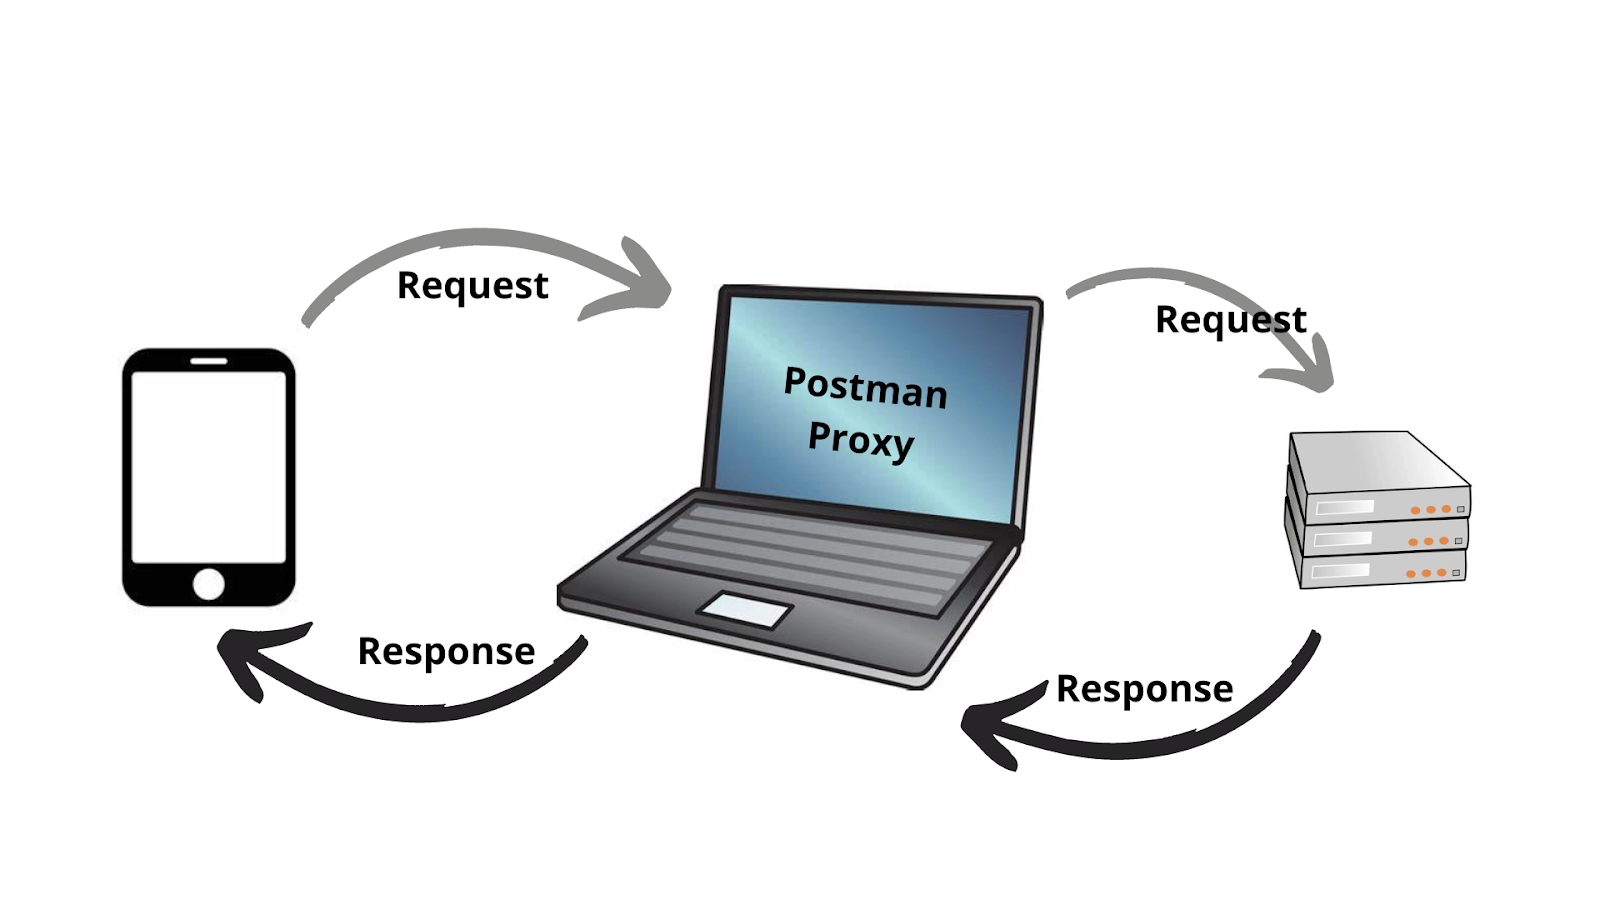
An intermediary server that sits between a client application and the final server is known as the Proxy Server. Its work is to communicate with the client application and the final server, like an API.
If you have enabled the Postman Proxy and have configured a client to use the proxy server, a request from the client first goes to the Proxy Server. This request is then forwarded to the final server.
While this process is going on, that is, when Proxy is enabled, you start a debug session. Postman captures any HTTP or HTTPS traffic passing through the proxy server, in such a situation. You can use this traffic, search, filter, or save it to a collection.
Using Postman Interceptor
The Postman Interceptor is just another way of capturing request data. The requests sent are between a client and a server. Every step of the process works the same as in the case of Postman Proxy.
The only difference is that Interceptor uses a Chrome plug-in rather than Postman’s built-in Proxy. You can capture HTTP and HTTPS requests sent from a Google Chrome Browser via Postman Interceptor.
Capturing HTTP Requests
If you are building client-side or desktop applications, an inspection of the incoming and outgoing request traffic becomes necessary. You may need to inspect the actual HTTP, and HTTPS Traffic sent and received in the application. Sometimes, it happens that you might have to discover APIs that are not even documented.
The Postman Proxy captures the calls made by the client app or device. After being captured, this request is forwarded to the server. The server returns the request to the Postman Proxy and then to the client. When we use the term built-in, it is one such facility provided by the user which does not need to be configured.
To learn more about the working of the built-in proxy, refer to the image below.
To use the Postman Proxy for capturing HTTP Requests, you must follow the below steps:
Step 1: Enable the Postman Proxy.
To enable the proxy, select the Capture Requests option from the Postman Footer. Select the Via Proxy tab from the window that appeared. In the upper right corner, you will see Enable Proxy option. Select that and enter the port number. Select Enable Proxy option again to confirm the details.
Step 2: Start with the Proxy debug session.
The Proxy Debug Session is a time-bound session in which captured traffic is saved in the form of an entry in the History Tab.
To start a session, open the Capture requests window from the Via Proxy Tab. To save each request’s responses, select Save Responses for Requests option. If you want to save requests not only in History Tab but also in collections, select Save Requests to a Collection and choose a collection. Select Capture Cookies if you want to capture cookies along with the requests.
All the requests and responses are added chronologically by default. But, if you want to organize those requests and responses, you can choose Organize Requests by option and manage their domain name, endpoints, or both. You can access additional options by selecting Configure Incoming Requests option. Then, select Capture.
Step 3: Configure the proxy server on a client device.
Firstly, find the local IP address of the machine in which the proxy server is running using the system’s settings. Open the wireless settings section of client’s device and then update the network connection’s configuration so that it can use HTTP Proxy.
Go back to the Postman app and open the Proxy debug session window. Now, open the web browser or application and let HTTP traffic pass through it.
Step 4: Run the proxy debug session.
While you are running your capture session, you can use the application or browser on the client’s device to see captured traffic using Proxy Debug Session window.
You can refer to the table below to learn about several controls used to limit, organize, and investigate traffic.
Controls
Uses
Proxy debug session
To change the Window name.
Configure incoming requests
Consists of various parameters such as Methods, Status Codes, Resources, and URL to limit the captured traffic.
Capture Cookies
Should be selected to collect cookies.
Save Responses for Requests
Should be selected to collect responses.
Requests Tab
Used to get information about incoming requests.
Cookies Tab
Used to get information about captured cookies.
Search Box
To find specific requests.
Next
Select to expand it for more details.
URL
To open the request as new API request.
Delete
To delete the request or cookie
Step 5: Stop the debug session and the proxy server.
In the lower right corner, you will see the Stop option. This option will finish the session and save the results in the History Tab. The Proxy is still running, so either start a new session or disable the Proxy.
Step 6: View and analyze the proxy debug session results.
From the History Tab, you can access the results of the Proxy debug session and analyze them. You can use the parameters such as start time, total size, duration, and source for the same. The Overview option displays summary graphs that have been summarized on the basis of method, domain, data mode, or return status code. You can choose one from the graphs available as per your requirements.
The Requests and Cookies Tab contains options for searching, expanding, saving, and deleting items. You can use these options any time you feel a change has to be made after analyzing the results.
Frequently Asked Questions
How can we use Postman’s search and filtering capabilities?
We can use Postman’s search and filtering capabilities to our advantage by narrowing down the requests based on the criteria chosen. This criterion can be chosen based on the requirements of the client.
Mention the steps to enable Proxy Server.
To enable the Proxy Server, follow the steps mentioned below.
From the Postman Footer, select the Capture requests icon.
A window will appear. From that window, open the Via Proxy Tab.
In the Upper right corner, you will see the option to Enable Proxy.
Select that.
Which operating systems facilitate setting up a proxy server?
The various operating systems that facilitate setting up a proxy server are Windows, Linux, MacOS, and Android.
Why is it not advisable to use GET Requests for some sensitive information?
This is because GET Requests receive all their information from a URL that is visible all the time to every user. That’s why it is not advisable to use GET Requests while sending some crucial information, such as passwords.
Conclusion
In this article, we have extensively discussed what Request Parameters are, their types and ways of capturing Request data using Postman Proxy and Postman Interceptor. We also learned how to capture HTTP requests in this blog later.


 9+ registered

