


Introduction
Measurement of central tendency is a summary statistic representing the center point or typical value of a dataset. As such, measures of central tendency are also known as measures of central location. They are also classed as summary statistics. We can think of it as the measure of data to cluster around a central value. In statistics, the three most used measures of central tendency are the mean, the median, and the mode.
Choosing the best measure of central tendency is not a piece of cake. It depends on the type of data. In this post, we will explore these measures of central tendency, show you how to calculate central tendency for categorical data. So before diving into the calculation, first look into categorical data.
Categorical Data
The accuracy of a machine learning model not only depends on the algorithm we choose and the hyperparameters but also on how we feed and process different types of features to the model. Machine learning models mainly accept numerical variables; preprocessing the categorical variables becomes necessary. We need to transform these categorical variables to numbers such that the model can understand and extract valuable information.
Categorical variables are usually represented as 'categories' or 'strings' and are finite. Some of the few examples are
- The city where people live: Delhi, Mumbai, Ahmedabad, Bangalore, etc.
- The highest degree of a person: High school, Diploma, Bachelor's, Masters's, Ph.D.
- A student's grades: A, A+, B+, B-, B.
In the above examples, the categories have definite possible values only. There are two kinds of categorical data:
- Ordinal Data: The classes have an inherent order,i.e., ordering matters.
- Nominal Data: The classes do not have an inherent order, i.e., the order does not matter.
In Ordinal data, while encoding, we should retain the order in which the category is given. For example, the highest degree a person possesses in the above example provides vital information about his qualification.
While encoding Nominal data, the presence or absence of data matters. In such a case, no order is present. For example, the city a person resides. For the data, it is essential to retain where a person resides. We do not have to give importance to order or sequence. It is equal whether a person lives in Delhi or Mumbai.
For encoding categorical data, we have a python package, category_encoders.
Now we know what's categorical data, let us look into the different measures of central tendency.
Mean
It is one of the most common, well-known measures of central tendency. Mean can be applied in both continuous and discrete data. Calculation of mean is pretty simple, and it is the sum of different values of observations divided by the number of observations.
In the normal distribution, the mean is the center of the data. While in a skewed distribution, the mean can miss the mark. The problem occurs because outliers have a significant impact on the mean. The extreme values in an extended tail pull the mean away from the center. Hence, the mean is drawn further away from the center as the distribution becomes more skewed. Consequently, it's best to use the mean to measure the central tendency when you have asymmetric distribution.
Median
The median represents the middle value. The median value splits the dataset into two halves. To find the median, sort the data in ascending order and find the data point with equal values above and below it. The outliers and skewed data have less impact on the median. When we have a skewed distribution, the median is a better measure of central tendency than the mean.
In the case of symmetric distribution, the mean and median are approximately equal and around the center. In the case of skewed distribution, outliers in the tail pull mean away from the center towards the long tail.
Note: Statisticians say that the median is robust, while the mean is sensitive to outliers and skewed distributions.
Mode
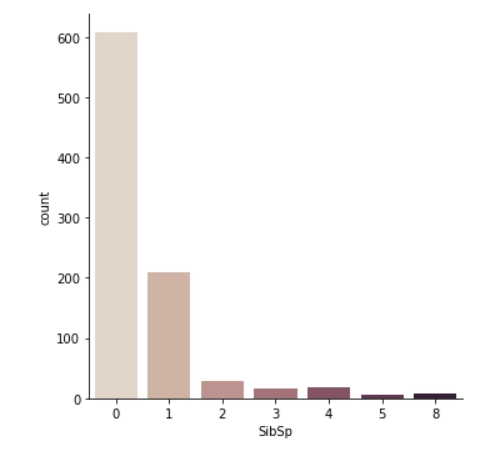
The mode represents the most frequent value in the data set. On a vertical bar chart, the mode is the tallest bar. If the data have multiple values that appear the most often, we have a multimodal distribution. If no value repeats or each value have the same frequency, then the data do not have a mode.
Now the problem with the mode is that it is not unique, we can have multimodal distribution as mentioned above, so it leaves us with situations when we have two or more values that share the highest frequency. Secondly, it will not return an accurate measure of central tendency when the most common mark is far from the rest of the data set.


 9+ registered

