Introduction
Before jumping to the methods of creating a chart in an excel chart sheet, let us first understand what it entails. A ChartSheet represents a chart sheet or a worksheet that only contains a chart.
Whenever a user creates a chart in Excel, the default settings of the software program will embed it into the sheet with other data; however, the user if want can move the chart to a separate sheet. The Chart Sheet class has some data Worksheet functionality, such as margins, tab selection, footers, headers, and print properties, but its primary purpose is to display a single chart. This distinguishes it from standard data worksheets, which can include one or more embedded charts.
In this article, we are going to discuss how to create a chart in an Excel chart sheet.
Let’s get started now:
Method: Move the Chart to a Chart Sheet
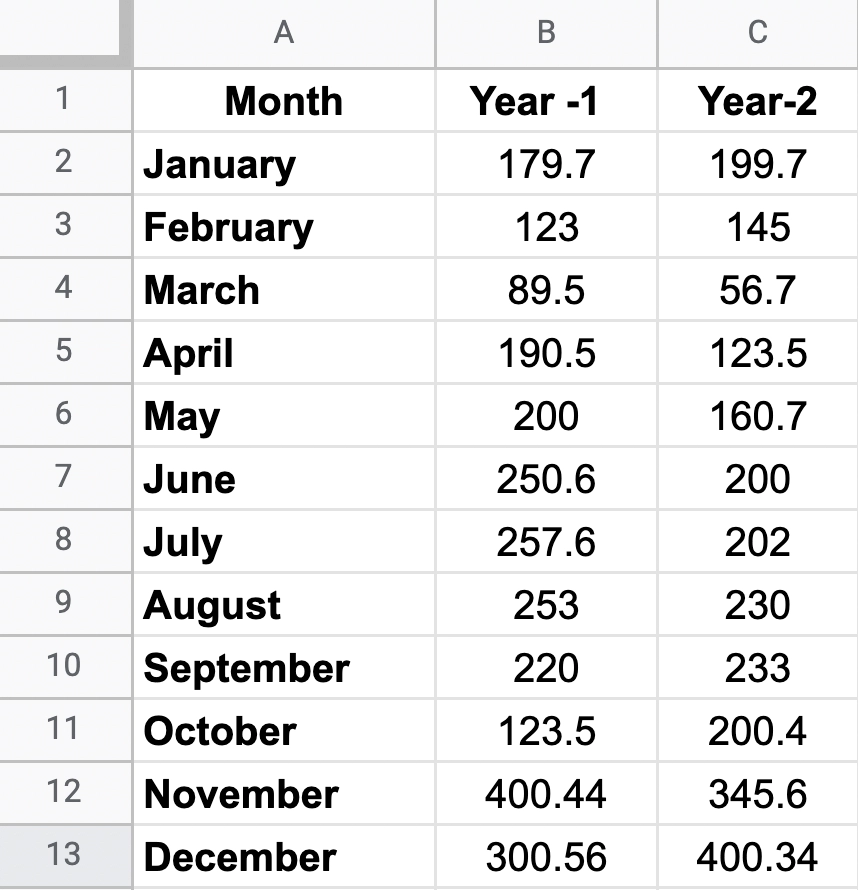
For creating a chart in an excel chart sheet, we must have some data. In this example, we are taking the sales volume as seen below.

In this method, we create a chart in the worksheet, then will move it to a new chart sheet.
-
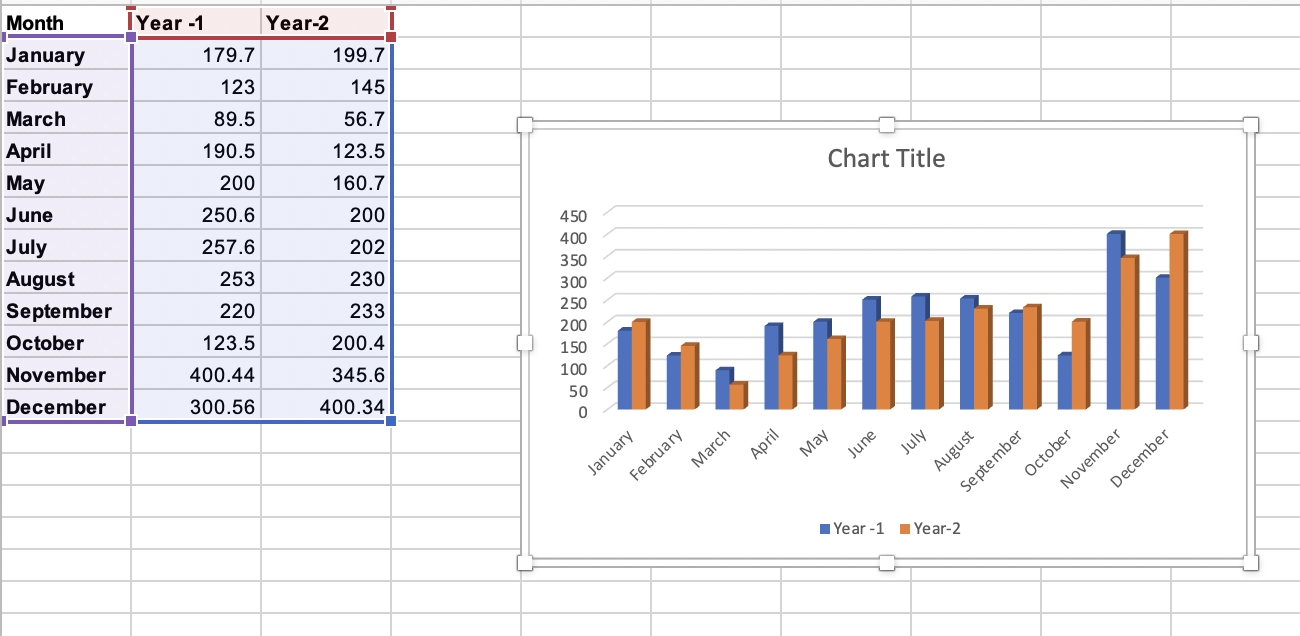
Create a chart in the current sheet.

-
Click on the chart and then you’ll see the respected options related to the chart on the top.

-
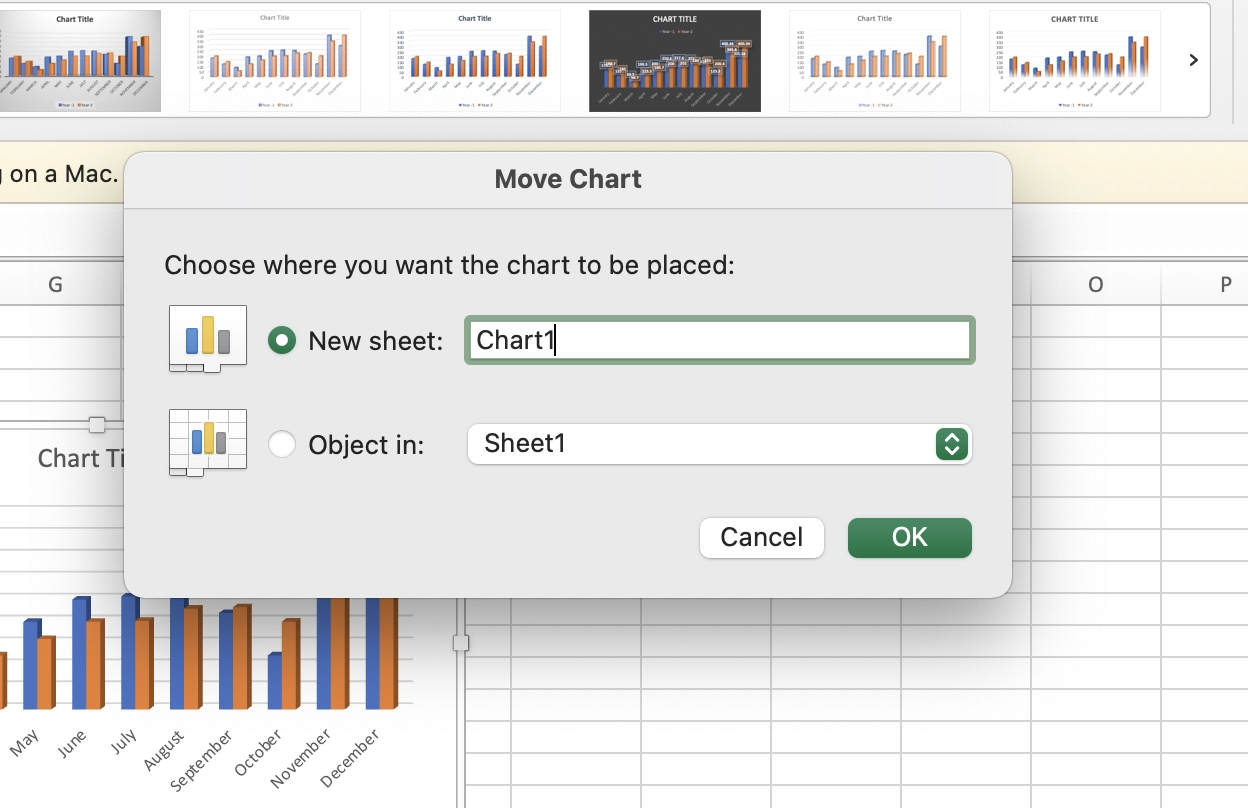
Click on the Move Chart option. Choose the option "New Sheet" in the "Move Chart" window. Change the chart name here if necessary.

-
Press OK.
Now, we have moved our chart onto a separate chart sheet.


