


Introduction
Chef Compliance simplifies maintaining and enforcing compliance across an enterprise, with audits based on specific standards tuned to adapt to the organisation’s needs in hybrid and multi-cloud environments. It allows for the correction and remediation of configuration drifts from the desired state. Organisations can monitor the compliance state and automatically reconfigure the IT resource into compliance. Chef provides compliance reports, and the facility runs scan jobs and inspects profiles to maintain compliance. Let us look at each of these in detail.

Reports
Source
Reports provide information on the infrastructure compliance status. Scan results for audit cookbook configurations can also be viewed on this page. All results are listed in the dashboard with end times on the selected day. The currently selected day is a timestamp in the Coordinated Universal Time (UTC). A historical overview of node status over time is represented using trend graphs. The period can be ten days, one month, three months, or one year.
Filtering
Users can view and filter specific compliance scan results by setting one or more filters. Wildcard characters like * can also be used to filter results. For instance, ‘Node Name: prod*’ will list all node names starting with the pattern prod. Following are some of the filters available to refine the searches.
- Chef Infra Server
- Chef Organization
- Chef Tag
- Control Tag
- Controls
- Environment
- InSpec Version
- Node Name
- Platform
- Policy Group
- Policy Name
- Profile
- Recipe
-
Role
Deep filtering is a method used to obtain reports on compliance profiles and controls. It uses the profile_id attribute to check the granular level of the compliance status. Filtering with the profile_name attribute creates a report for every version of profile_name in the infrastructure.
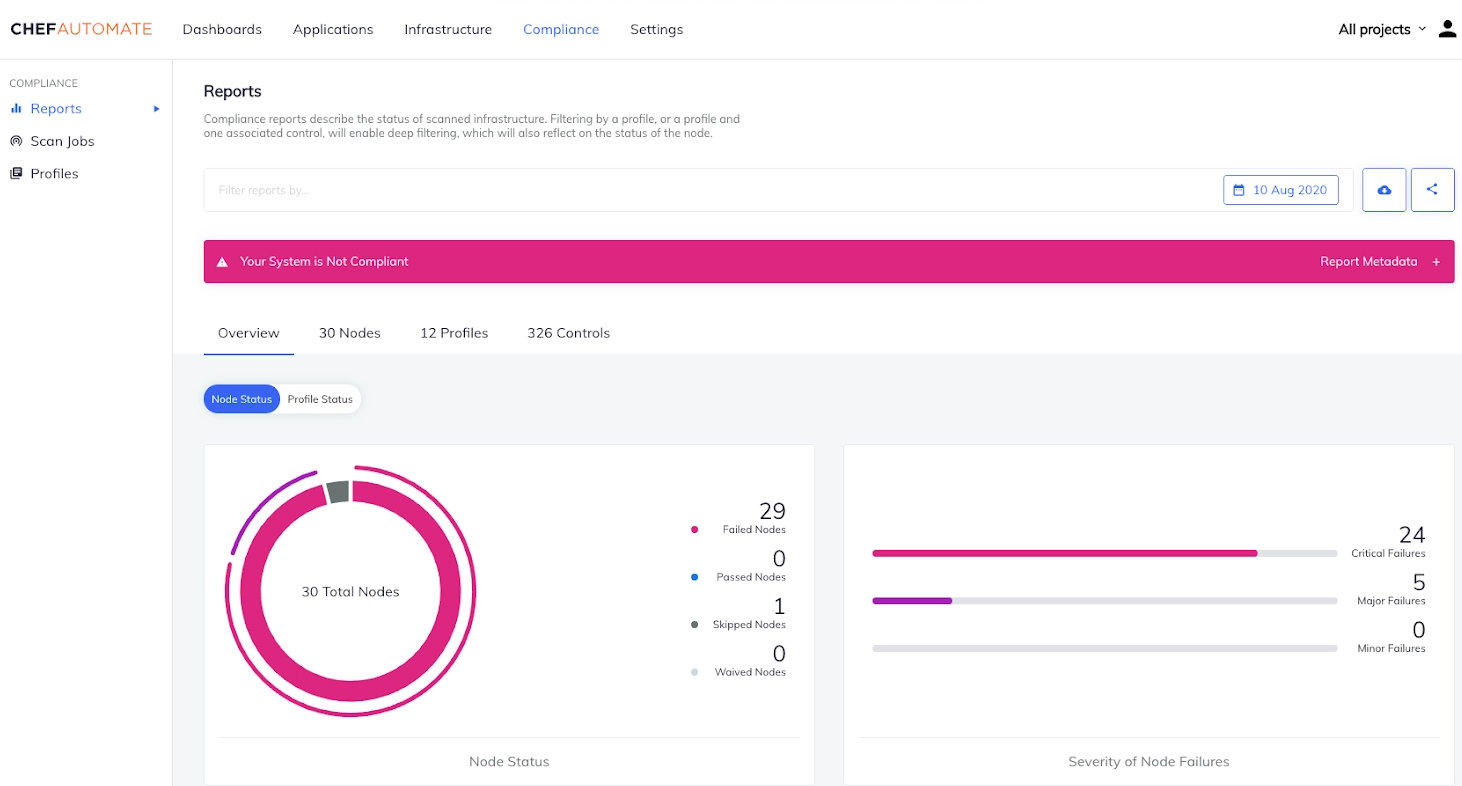
Compliance Overview
The system’s compliance state can be viewed in Node status and Profile status views. A system’s compliance status from the operational perspective of nodes can be observed in the Node status view. It displays the following.
- Node Status
- The severity of Node Failures
- Node Status Over Time
- Top Platform Failures
-
Top Environment Failures
The Profile Status view shows the system’s compliance status from the compliance perspective of profile runs during scans. It displays the following.
- Control Status
- The severity of Control Failures
- Control Status Over Time
- Top Profile Failures
-
Top Control Failures
Users can also switch between tabs to view compliance reports taken from various perspectives, namely, Nodes, profiles and Controls.
-
The Nodes view gives insight into the compliance status of the nodes in the system. It provides information about the Node, Platform, Environment, Last Scan and Control Failures, if any.
-
The Profiles tab lists the compliance profiles installed under a user account. It shows the Profile title, Version and Identifier.
- The controls tab shows all the compliance controls installed under a user account. It displays Control Name, Profile, Impact, Last Scan and Node Status.


 18+ registered

