Do you think IIT Guwahati certified course can help you in your career?
Introduction
In the dynamic realm of telecom, customer retention is paramount for sustainable growth. Churn prediction, a data-driven strategy, guides telecom companies towards understanding and mitigating customer attrition.
This article delves into Churn Prediction in Telecom Industry and its impact on the telecom industry.
Understanding Churn Prediction
Churn prediction is the art of foreseeing which customers will likely terminate their association with a telecom provider. By scrutinizing historical data and behavioral patterns, businesses can unravel the potential churn signals, enabling proactive measures to retain customers.
Significance of Churn Prediction in Telecom
Churn prediction is pivotal for telecom enterprises as it lays the foundation for minimizing customer churn rates. Identifying potential churners in advance equips businesses to tailor personalized retention strategies, encompassing bespoke offers, enhanced services, and empathetic support. This proactive approach not only safeguards revenue streams but also nurtures brand loyalty.
Let us see a sample churn prediction code.
Code Implementation
Step 1: Import Libraries
import numpy as np
import pandas as pd
from sklearn.preprocessing import MinMaxScaler, StandardScaler
from sklearn.model_selection import train_test_split
from sklearn.metrics import accuracy_score, mean_absolute_error, mean_squared_error
import seaborn as sns
import matplotlib.pyplot as plt
from sklearn import tree
from sklearn.ensemble import RandomForestClassifier
from xgboost import XGBClassifier
from sklearn.cluster import KMeans
from sklearn.metrics import precision_score
from sklearn.model_selection import train_test_split
from sklearn.tree import DecisionTreeClassifier
from sklearn.metrics import accuracy_score, precision_score, recall_score
from sklearn.tree import DecisionTreeClassifier
from sklearn import metrics
from sklearn.ensemble import RandomForestClassifier
from sklearn import metrics
Step2: CSV File
Consider a .csv file having all the information as a CSV (Comma-Separated Values) file is used to store data structured as a table. The CSV file is the dataset on which you build and train your prediction model.
# Load the CSV file into a DataFrame
df = pd.read_csv('telecom_data.csv')

# size of the dataset
df.shape
df.head()
Output
print("DataFrame Info:")
print(df.info())
Output
Step 3: Exploratory Data Analysis
Exploratory Data Analysis (EDA) involves visually and statistically exploring datasets to understand patterns, relationships, and anomalies.
It includes:
data overview (we have seen this above as df.head)
summary statistics,
visualizations,
correlation analysis,
outlier detection, and
hypothesis generation.
EDA guides data preprocessing, model building, and decision-making by revealing insights into data characteristics and trends.
Summary statistics
This summary statistics table gives you a quick overview of the numeric data's central tendency, spread, and distribution.
# Outlier Detection (Assuming 'TotalCharges' is a numeric column)
plt.figure(figsize=(6, 4))
sns.boxplot(data=df, x='Churn', y='TotalCharges')
plt.title('TotalCharges vs. Churn')
plt.show()
Output
Hypothesis Generation
# Hypothesis Generation
# Example: Let's generate a hypothesis that higher data usage might lead to higher churn rates
data_usage_churn = df.groupby('Churn')['MonthlyUsage(GB)'].mean()
print("\nHypothesis: Higher data usage leads to higher churn rates:")
print(data_usage_churn)
Output
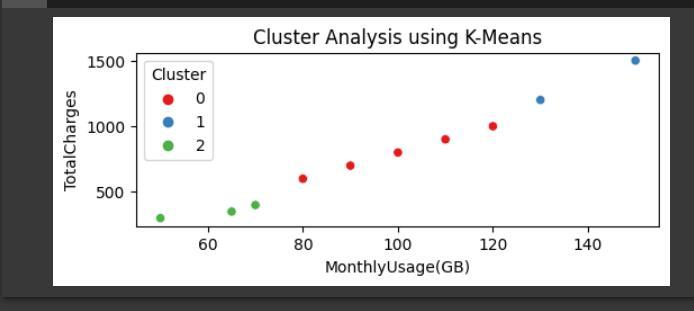
Step 4: Cluster Analysis
Here, the code adds a fundamental cluster analysis using K-Means clustering to group customers based on their age, monthly usage, and total charges. It assigns customers to clusters and then visualizes the clusters on a scatter plot.
# Cluster Analysis using K-Means
X_cluster = df[['Age', 'MonthlyUsage(GB)', 'TotalCharges']]

# Choose the number of clusters (e.g., 3 clusters)
num_clusters = 3
kmeans = KMeans(n_clusters=num_clusters, random_state=42)
df['Cluster'] = kmeans.fit_predict(X_cluster)

# Visualize clusters
plt.figure(figsize=(10, 6))
sns.scatterplot(data=df, x='MonthlyUsage(GB)', y='TotalCharges', hue='Cluster', palette='Set1')
plt.title('Cluster Analysis using K-Means')
plt.show()
Output
Explanation:
Red Cluster: The red points in the scatter plot represent a group of customers who share similar patterns in monthly data usage and total charges.
Blue Cluster: The blue points correspond to another group of customers with distinct patterns in monthly data usage and total charges.
Green Cluster: Similarly, the green points denote a different cluster of customers.
Step 5: Data Preprocessing
Before developing, we need to hot encode all the categorical features in the dataset.
# One-hot encoding for categorical columns
categorical_columns = ['Gender']
df = pd.get_dummies(df, columns=categorical_columns, drop_first=True)

X = df.drop(columns=['MonthlyUsage(GB)', 'Churn'])
y = df['Churn']

# Split data into train and test sets
X_train, X_test, y_train, y_test = train_test_split(X, y, test_size=0.2, random_state=42)

# Build and train a Decision Tree Classifier
decision_tree_classifier = DecisionTreeClassifier(max_depth=6, random_state=42)
decision_tree_classifier.fit(X_train, y_train)

# Make predictions on the test data
y_pred = decision_tree_classifier.predict(X_test)

# Calculate accuracy, precision, and recall
accuracy = accuracy_score(y_test, y_pred)
precision = precision_score(y_test, y_pred, pos_label='Yes')  # Specify the positive label
recall = recall_score(y_test, y_pred, pos_label='Yes')  # Specify the positive label

# Print evaluation metrics
print(f"Accuracy: {accuracy:.2f}")
print(f"Precision: {precision:.2f}")
print(f"Recall: {recall:.2f}")
Output
Step 6: Developing the ML Models
# Initiate and fit Decision Tree Classifier
decision_tree_classifier = DecisionTreeClassifier(max_depth=6, random_state=1234)
decision_tree_classifier.fit(X_train, y_train)  # Use your actual X_train and y_train variables

# Predict label for the test data
prediction_values_dt = decision_tree_classifier.predict(X_test)  # Use your actual X_test variable

# Print classification report and confusion matrix
print("Classification Report:")
print(metrics.classification_report(y_test, prediction_values_dt, digits=2))

print("Confusion Matrix:")
print(metrics.confusion_matrix(y_test, prediction_values_dt))
Output
Explanation:
As we can see in the above figure, that accuracy is 53%. The precision and recall for the positive class are 47% and 22%, respectively.
Let's build a Random Forest classifier next:
# Initialize Random Forest Model
random_forest = RandomForestClassifier(n_estimators=1000, max_depth=3, random_state=1234)
random_forest.fit(X_train, y_train)  # Use your actual X_train and y_train variables

# Predict label for the test data
prediction_values_rf = random_forest.predict(X_test)  # Use your actual X_test variable

# Print classification report and confusion matrix
print("Classification Report:")
print(metrics.classification_report(y_test, prediction_values_rf, digits=2))

print("Confusion Matrix:")
print(metrics.confusion_matrix(y_test, prediction_values_rf))
Output
Explanation:
With Random Forest, we got an accuracy of %, slightly less than the decision tree. This model's precision and recall score is 47% and 38%, respectively.
So, we can say that the Random Forest model is better at correctly identifying actual positive instances (instances belonging to the positive class) compared to the Decision Tree model. It has a lower false negative rate, meaning it can capture more positive instances from the dataset.
Methods for Accurate Churn Prediction
Leveraging Machine Learning: Employing machine learning algorithms such as decision trees, logistic regression, and neural networks empowers businesses to create predictive models based on individual customer data, foreseeing churn probabilities.
Customer Segmentation Strategies: Segmenting customers based on behavior and traits facilitates precise targeting. This segmentation approach aids in customizing retention interventions for distinct customer clusters.
Enhancing Churn Prediction Accuracy
Smart Feature Selection: Handpicking pertinent variables like customer demographics, usage history, billing patterns, and interactions fuels the predictive model's accuracy.
Rigorous Model Evaluation: Scrutinizing churn prediction models through metrics like accuracy, precision, recall, and F1-score refines the model's predictive prowess.
Business Transformations with Churn Prediction: Churn prediction transcends technical algorithms; it orchestrates tangible business metamorphoses. Lower churn rates enable:
Amplified customer lifetime value.
Elevated customer loyalty and retention rates.
Efficient resource allocation to cater to high-risk customers.
Revenue augmentation through the retention of high-value clientele.
Significance of Churn Prediction in Telecom
Churn prediction is pivotal for telecom enterprises as it lays the foundation for minimizing customer churn rates. Identifying potential churners in advance equips businesses to tailor personalized retention strategies, encompassing bespoke offers, enhanced services, and empathetic support. This proactive approach not only safeguards revenue streams but also nurtures brand loyalty.
Methods for Accurate Churn Prediction
Leveraging Machine Learning: Employing machine learning algorithms such as decision trees, logistic regression, and neural networks empowers businesses to create predictive models based on individual customer data, foreseeing churn probabilities.
Customer Segmentation Strategies: Segmenting customers based on behavior and traits facilitates precise targeting. This segmentation approach aids in customizing retention interventions for distinct customer clusters.
Enhancing Churn Prediction Accuracy
Smart Feature Selection: Choosing important information like customer details, how they use a service, their payment habits, and how they interact helps the prediction model work better.
Rigorous Model Evaluation: Evaluating churn prediction models using measures like accuracy, precision, recall, and F1 score improves the model's accuracy.
Business Transformations with Churn Prediction
Churn prediction transcends technical algorithms; it orchestrates tangible business metamorphoses. Lower churn rates enable:
Amplified customer lifetime value.
Elevated customer loyalty and retention rates.
Efficient resource allocation to cater to high-risk customers.
Revenue augmentation through the retention of high-value clientele.
Frequently Asked Questions
What is churn prediction in the telecom industry?
Churn prediction forecasts which customers will likely leave a telecom provider by analyzing data patterns.
How does churn prediction enhance customer retention?
Churn prediction helps identify potential churners beforehand, allowing businesses to implement personalized strategies for customer retention.
Could you share a successful churn reduction example?
Certainly! By implementing data-driven strategies, a telecom giant reduced churn rates by 20%, increasing revenue and customer satisfaction.
Conclusion
Churn prediction isn't just a data exercise; it's a business imperative. By harnessing predictive insights, telecom companies can anticipate churn, tailor strategies, and foster enduring customer relationships. In a competitive landscape, churn prediction guides telecom success toward customer-centric growth.
Now that you have learned about Churn Prediction in Telecom Industry, you can refer to the following article:


 8+ registered

