Do you think IIT Guwahati certified course can help you in your career?
Introduction
Classification in machine learning are techniques to analyze data patterns and assign categorical labels to new unseen data. These are multiple classification algorithms to make predictions and classify data into distinct classes based on their features.
We will look into classification in machine learning in more depth.
What is Supervised Learning?
Supervised learning is a machine learning-based approach where machines are trained using labeled data to make predictions. We can make predictions by mapping input variables to output variables. Some examples of supervised learning include:
We must have used various online platforms that predict movies and products. They use supervised learning to make personalized predictions on movies and products based on user inputs.
There are many voice assistants in the market. These voice assistants use supervised learning to recognize and interpret spoken commands enabling them to respond.
We can filter spam in emails to filter out unwanted spam.
Types of Supervised Learning
There are two types of supervised learning, namely:
Classification
Classification in machine learning is a supervised learning task that involves assigning classes to input data.
Regression
Regression is a supervised learning task that predicts continuous numerical variables based on input variables.
What is Classification?
Classification is a task that involves labelling data into distinct classes on the basis of features and characteristics. The purpose of classification algorithm is to accurately predict the class of the new unseen data based on the features from the training data.
The classification task usually comprises of two stages:
Training phase
The training phase is used to train the model by identifying features and labels.
Predicting phase
The predicting phase predicts the class of the new unseen data.
In this article, we will look at classification algorithms in detail.
What is a Classification Algorithm?
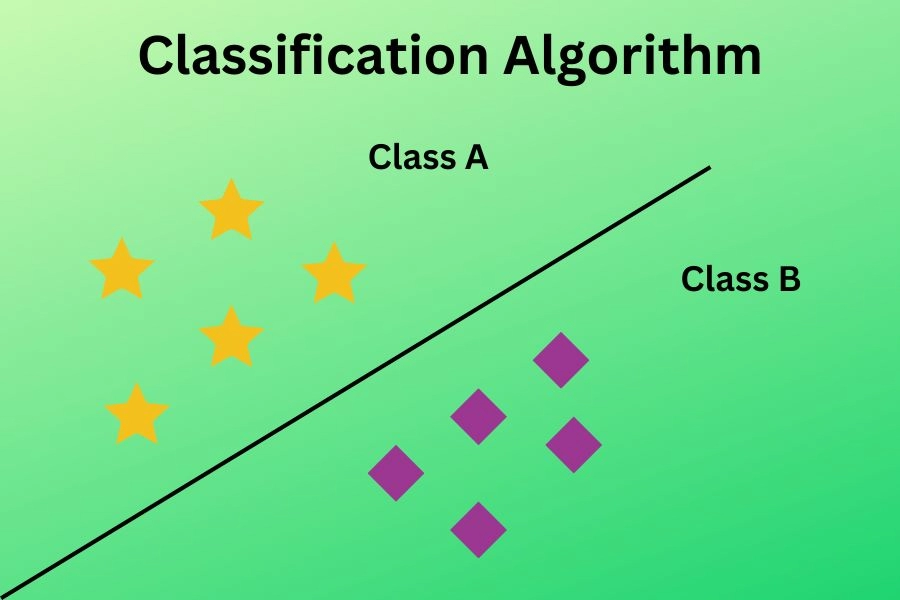
A classification algorithm is a supervised learning algorithm used to predict the class of the data it belongs to based on the labeled data.
We can understand the classification algorithm from the figure shown above. There are two classes: class A and class B where each class has similar feature objects which are different from objects in other classes.
A classifier refers to the algorithm that is used to perform classification on a dataset. We will learn more about classifiers later.
The classification process involves the following:
Training the algorithm on a labeled dataset.
Categorizing them into classes.
Classifying the unseen data into one of the classes.
Example 1
Let's say we have a sequence of emails coming, and we want to segregate them based on spam and not spam.
Suppose we have training data as:
Email 1: “We have detected a virus in your device”.
Class: spam
Email 2: “Hope you are doing well”.
Class: not spam
Email 3: "Get rid of the virus in your device".
Class: spam
Email 4: “Let’s have a meeting”.
Class: not spam
Now let’s say we get a new mail that says “This virus can kill your device”.
Therefore, now we can label the new mail as “spam” based on the trained data as the word “virus” comes into the new mail.
Example 2
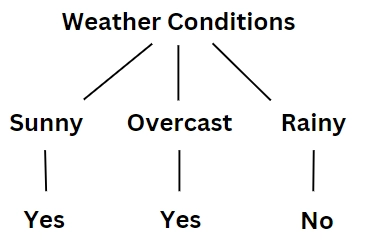
Let’s take another example where we decide whether to play cricket or not based on the weather conditions.
Here, the weather condition is the root node and it has three branches: “sunny”, “rainy” and “overcast”. The decision tree reaches the final attribute.
Here, based on the root to leaf path a person can decide whether he/she should play cricket or not.
Learners in Classification Problems
There are mainly two types of learners in machine learning:
Lazy Learners
Lazy learners store the training data and classify the most similar cases when test data arrives. It is called lazy learners because it spends less time on data training and more time on data testing. For example, K nearest neighbor.
Eager Learners
Eager learners, however, store and develop a classification model on the training data before receiving any testing data. It spends more time on the training of data and spends less time on the testing of data. For example, Decision trees.
Types of Classification Tasks
Classification in machine learning are supervised learning tasks that categorize the data based on the training data. Here are some examples of classification tasks:
Binary Classification
This task involves classification into one of two possible classes. For example, spam or not spam, true or false, etc.
Multiclass Classification
This task involves classification into more than two possible classes. For example, image recognition in the case of cats, dogs, and cows.
Multi Label Classification
This involves assigning multiple labels to each instance. For example, text categorization is where the text can be assigned to multiple tags.
Imbalance Classification
In imbalance classification, there is an imbalance between the number of instances in different classes. For example, credit card fraud detection.
Hierarchical Classification
In hierarchical classification, the classes are organized into a hierarchy. Each instance is classified into a specific class and its ancestors in the hierarchy. For example, in a food chain where a tiger is at the top of the hierarchy, deer is below the tiger, and the grass is at the bottom.
Types of ML Classification Algorithms
Classification Algorithms are divided into two categories:
Linear Models
Logistic Regression
Support Vector Machines
Non-linear Models
Kernel Support Vector Machines
Decision Tree
Random Forest
Naive Bayes
K-Nearest Neighbours
We will discuss some of them in detail:
Logistic Regression
Logistic regression is a classification algorithm that models a relationship between input variables and the probability of belonging to a specific class. For example, predicting whether a loan applicant will default or not based on the credit score and income using logistic regression.
Support Vector Machines
Support vector machines (SVM) is a type of algorithm that tries to draw a line or boundary that separates different groups of data points. The goal is to find the best line that maximizes the space between the closest data points of other classes.
For example, we need to classify a dog and a cat based on weight, height, shape of ears, and tail. Here SVM can be used to find the best possible line that separates the two animals, and the new data can be easily fit into one of the two classes.
Kernel Support Vector Machines
Kernel SVM (Support Vector Machines) is a nonlinear classification task which transforms data to high dimensional feature space using kernel functions. It becomes easier to separate different classes using SVM. This allows SVM to effectively handle nonlinear relationships and achieve accurate predictions.
For example, we can classify different flowers based on petal length and width.
Decision Trees
Decision trees are hierarchical structures that decide based on an input feature. Suppose you want to determine whether you need to wear a jacket. You can take the help of data of temperatures where if the temperature is less than 10 degrees, you need to wear a jacket otherwise, not.
Random Forests
Random Forests take into account multiple decision trees to make predictions. The final prediction of random forest is made by aggregating the prediction of individual trees.
For example, if we extend the example of a jacket in the last case, let's consider different factors such as temperature, wind speed, and precipitation, and then, from each model, we can decide whether we need to wear a jacket.
Naive Bayes
Naive Bayes is a probabilistic classifier. It is based on Bayes's theorem. It assumes that features are independent given the class label, known as the "naive" assumption. They can handle high-dimensional data. For example, predicting if an email is a fraud can be done using naive Bayes by taking the help of text classification.
Naive Bayes is based on bayes theorem which is given as:
P(A|B)= P(A)*P(B|A) / P(B)
In this equation,
P(A|B) is the probability of event A occurring given event B happens.
P(A) is the probability of event A.
P(B) is the probability of event B.
P(B|A) is the probability of event B occurring given event A happens.
K Nearest Neighbors
K nearest neighbors (KNN) is a supervised algorithm that classifies new data points based on their similarity to existing labeled data. It looks at the K nearest neighbors in the training data. Simply, it finds the K closest points and makes predictions based on their labels.
For example, a recommendation system model which predicts movies for you.
Evaluating a Classification Model
Evaluating a classification model means how well it predicts to the new unseen data. We will look at some common metrics.
Confusion Matrix
A confusion matrix summarizes the performance of a classification model by showing the counts of true positive, false positive, true negative, and false negative predictions. The matrix is shown below.
Actual Positive
Actual Negative
Predicted positive
True positive
False positive
Predicted negative
False negative
True negative
ROC AUC Curve
AUC is Area Under the Curve, and ROC stands for Receiver Operating Characteristics Curve. ROC and AUC evaluate how well a classification model can distinguish between different classes. Higher AUC values indicate better classification ability.
The ROC curve is plotted with True Positive Rate on the Y-axis and False Positive Rate on X-axis.
Accuracy
It measures the correctly classified instances out of the total number of instances. It may be biased in the presence of class imbalance. Based on the above shown table of confusion matrix.
Accuracy = (True Positive + True Negative) / Total Population
Precision
As the name suggests, precision calculates the proportion of true positive predictions (correctly predicted positive instances) out of all positive predictions (both true positives and false positives).
It is a common loss function used for measuring the dissimilarity between predicted probabilities and true labels. In simpler words it tells us how well a model predicts comparing to true outcomes by penalizing incorrect predictions. The lower log loss represents the higher accuracy of the model. It is calculated as:
Cross-validation evaluates performance of a model by splitting the available data into multiple subsets, called folds, and then iteratively training and testing the model on different combinations of these folds. It is used in case of overfitting of data.
Holdout Method
The holdout method, also known as simple split validation, is a technique that involves splitting the available data into two sets: a training set and a testing set. We train the model on a training set and then evaluated on the testing set, which consists of unseen data.
The unseen test set evaluates the ability to predict the data after it has been trained using the train set.
How to Select the Best Algorithm
Read and understand the problem statement and data characteristics.
Create training and testing data.
Evaluate the complexity and scalability of the algorithm.
Review the algorithm’s performance.
Compare multiple algorithms by evaluating each algorithm.
Finally, select the best algorithm.
Use of Classification Algorithm in Real Life
Credit card fraud detection
Disease diagnosis in the medical industry
Image recognition and object detection
Email spam filtering
Recommender systems
Predicting stock market trends, and many more.
Frequently Asked Questions
What is a classification in machine learning?
Classification in machine learning is the process of categorizing data points into predefined classes or categories based on their features. It's used for tasks like spam detection, image recognition, and sentiment analysis, where algorithms learn to make data-driven predictions about class membership.
What is classification learning?
Classification learning is a type of supervised machine learning where algorithms are trained to assign data points to predefined categories or classes based on their features. It's used for tasks like image recognition, text classification, and fraud detection.
What is difference between regression and classification?
Regression predicts continuous numeric values, while Classification assigns data to predefined categories. Regression outputs numbers, while Classification assigns labels. They use distinct models, metrics, and are suited for different tasks like predicting prices (Regression) or detecting spam emails (Classification).
What is classification in machine learning Python?
Classification in machine learning with Python is the process of categorizing data into predefined classes or labels based on features. Common libraries like Scikit-Learn provide algorithms for tasks like spam detection, image recognition, and sentiment analysis.
Conclusion
In this article, we discussed classification in machine learning. You can also read the articletypes of machine learningto improve your knowledge on machine learning.
But suppose you have just started your learning process and are looking for questions from tech giants like Amazon, Microsoft, Uber, etc. In that case, you must look at the problems, interview experiences, and interview bundles for placement preparations.


 8+ registered

