Get a skill gap analysis, personalised roadmap, and AI-powered resume optimisation.
Introduction
Have you ever thought about how we can sort and group data to disclose hidden patterns and insights? Well, that's where the concept of clustering in data mining comes into play.
Clustering is a fundamental technique used in data mining to identify clusters within a dataset. It allows us to discover similarities and differences among data points, which makes it easier to understand complex data and extract valuable knowledge.
What is a Cluster?
A cluster is when you combine similar things and keep different things apart. Clusters help organize and categorize items by their similarities.
For example, let's consider a bunch of different vegetables as one group. Similarly, there could be another bunch of various fruits as a separate group. Here, in this case, fruits and vegetables are two clusters with similar items.
What is Clustering in Data Mining?
Clustering is a method used to categorize similar data points according to their attributes or characteristics. It discovers patterns present in a large dataset. While doing cluster analysis, we divide the data set into groups based on data similarity and then set the tags to the groups.
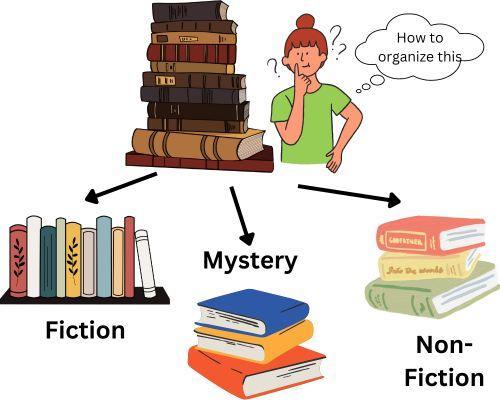
Suppose you wish to arrange a large number of books. Your objective is used to organize it to make it simple for individuals to find the related book based on their requirements. Using data analysis methods such as clustering, you can examine the attributes of books, such as their category, writer, language, and topic. Using clustering algorithms, you can group similar books based on these qualities.
People typically use clustering in data mining for various objectives such as data exploration, pattern recognition, anomaly detection, customer segmentation, and recommendation systems.
Features of Clustering in Data Mining
There are many features of Clustering in Data Mining such as:
Clustering in data mining is significant because it can work with large amounts of data without becoming slow.
Data clustering produces clear and relevant findings that provide valuable insights.
Clustering algorithms can recognize and adapt clusters with irregular or complicated shapes, unlike simple geometrical forms.
Clustering is extremely useful and versatile because it may group many data kinds, such as numbers and categories.
It can also effectively manage noisy or missing data.
Applications of Clustering in Data Mining
Clustering in data mining has various applications across different domains. Here are some key applications:
Customer Segmentation: It is used to group customers based on similar purchasing behavior. It helps businesses tailor marketing strategies for specific customer segments, enhancing customer satisfaction and loyalty.
Anomaly Detection: It is used to identify unusual patterns or outliers in datasets. It is useful for fraud detection, network security, or any scenario where abnormal behavior needs to be flagged.
Image Segmentation: It is used to group pixels in an image with similar attributes. It facilitates object recognition, image editing, and computer vision applications.
Document Clustering: It is used to group documents based on content similarity. It streamlines information retrieval, categorizes documents, and aids in organizing large document collections.
Genomic Data Analysis: It is used to group genes or DNA sequences with similar characteristics. It assists in understanding genetic patterns, identifying potential disease markers, and enhancing biomedical research.
Example for Clustering Algorithm
Let’s understand the Clustering Algorithm with the help of an example.
Code
# Import necessary libraries
import numpy as np
import matplotlib.pyplot as plt
from sklearn.datasets import make_blobs
from sklearn.cluster import KMeans
# Generate sample data
n_samples = 100
clusters = 5
random_state = 42
X, _ = make_blobs(n_samples=n_samples, centers=clusters, random_state=random_state)
# Apply clustering algorithm
coding_ninjas_kmeans = KMeans(n_clusters=clusters, random_state=random_state)
coding_ninjas_kmeans.fit(X)
centroids = coding_ninjas_kmeans.cluster_centers_
labels = coding_ninjas_kmeans.labels_
# Adding color to the clusters
custom_colors = ['#1f77b4', '#ff7f0e', '#2ca02c', '#d62728', '#9467bd']
# Map color to the clusters
cluster_colors = [custom_colors[label] for label in labels]
# Plot the data and the centroids
plt.scatter(X[:, 0], X[:, 1], c=cluster_colors, edgecolors='k')
plt.scatter(centroids[:, 0], centroids[:, 1], marker='x', s=200, c=custom_colors, label='Centroids')
plt.legend()
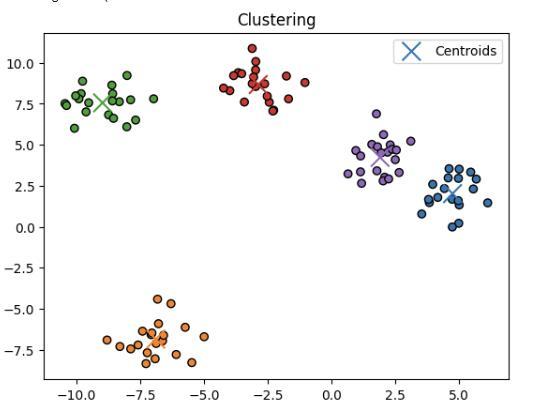
plt.title('Clustering')
plt.show()
Output
Explanation
In this code, we have performed k-means clustering. It generates sample data using “make_blobs” from the “sklearn.datasets”. We have defined 5 clusters with 100 data points. We have used the k-means clustering algorithm in this code. In this algorithm, we have assigned data points to the nearest centroid and updated the centroid positions. After clustering is done, we obtain the cluster labels and centroid coordinates. We have added some color to identify the clusters correctly. We have marked the centroid with an “X” symbol.
Data Mining Clustering Methods
There are different types of clustering methods:
Partitioning Based Method
Density Based Method
Hierarchical Method
Fuzzy Clustering
Model-Based Clustering
1. K-means Clustering(Partitioning Based Method)
This method divides the data into non-hierarchical groups. One of the most common examples of partitioning-based methods is K-Means Clustering. It is also known as the centroid-based method.
In this, if there are 'n' objects or data items, they will be divided into 'k' partitions or clusters. In this case, each partition acts like a single cluster. In this case, k should be less than or equal to k. The partitions that are formed should satisfy two conditions:
Each partition should have at least one object.
Each object should belong to only one partition only.
For example
Let's take an example to understand this better. Suppose you have to organize a large amount of books. Instead of sorting them out at once, you used a partitioning-based method. In this approach, you start dividing the books into groups based on genre, like fiction, non-fiction or mystery, and so on. After doing this, you obtain subsets of books. You can further divide them according to the name of the authors. It will further divide the problem into subsets. Using a partitioning-based method, you can break down a significant problem into smaller ones.
2. Density Based Method
DBSCAN is an unsupervised machine learning algorithm that clusters data points based on their density. The clustering method based on density connects areas with lots of points together to form groups, regardless of their shapes. This algorithm finds clusters in the data set and links regions with many points to create clusters. Sparse areas separate the dense parts from each other in the data space.
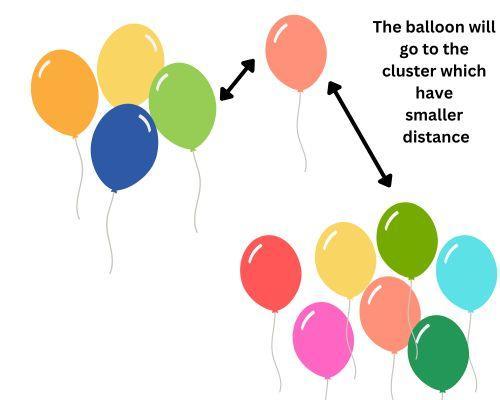
Let's understand this by an example. Suppose you have 100 balloons of different colors. They are randomly scattered in an area. Some are closely spaced to each other, while others are farther apart. Now, if we apply Density-based clustering to this case, we will start selecting a random balloon, and if other balloons are at an arm's length distance, we will include them in that cluster. We will keep expanding this cluster until there are no more balloons nearby.
3. Hierarchical Method
Hierarchical clustering is an unsupervised learning method that identifies the next clusters based on previously defined ones. It starts by thinking of each data point as its group. Then, it combines groups to create new ones with similar things but different from the other groups.
Let’s understand this with the help of an example.
Code
# Import libraries
import numpy as np
import matplotlib.pyplot as plt
from sklearn.datasets import make_blobs
from sklearn.cluster import AgglomerativeClustering
# Generate sample data
n_samples = 100
n_clusters = 5
random_state = 42
X, _ = make_blobs(n_samples=n_samples, centers=n_clusters, random_state=random_state)
# Apply hierarchical clustering
coding_ninjas_clustering = AgglomerativeClustering(n_clusters=n_clusters)
labels = coding_ninjas_clustering.fit_predict(X)
# Adding color to the clusters
custom_colors = ['#1f77b4', '#ff7f0e', '#2ca02c', '#d62728', '#9467bd']
# Map color to the clusters
cluster_colors = [custom_colors[label] for label in labels]
# Plot the data points with custom colors for each cluster
plt.scatter(X[:, 0], X[:, 1], c=cluster_colors, edgecolors='k')
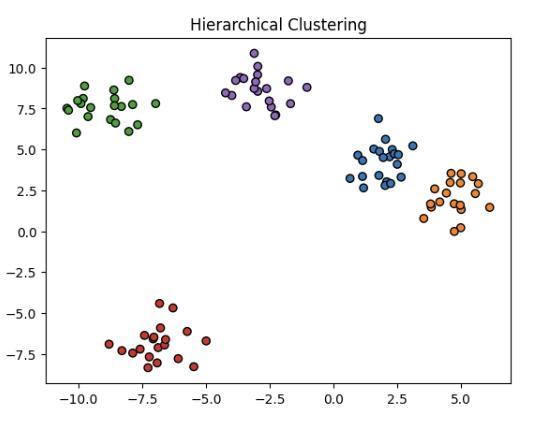
plt.title('Hierarchical Clustering')
plt.show()
Output
Explanation
We have performed hierarchical clustering in this code using the “AgglomerativeClustering” algorithm. It has been imported from “sklearn.cluster”. We have defined 5 clusters with 100 data points using “make_blobs” from “sklearn.datasets”. In Agglomerative clustering, first, all data points are considered individual clusters. It then iteratively merges the closest data points into clusters. It forms a dendrogram that shows how clusters are merged. We have specified the number of clusters we want. We have added some color to identify the clusters correctly.
4. Fuzzy Clustering
Fuzzy clustering is a method used in data analysis to group data points into clusters based on their similarities. Unlike regular clustering methods that assign each data point to only one cluster, fuzzy clustering allows for a more flexible and uncertain approach.
It gives each data point a membership value that shows how much it belongs to each cluster. The fuzzy clustering algorithm calculates these membership values and adjusts them gradually to get the best clustering outcome.
For example
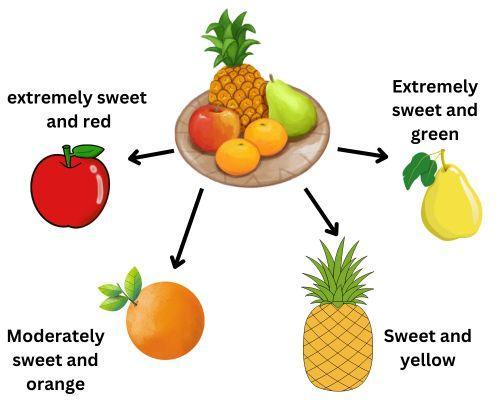
Consider a simple example of fuzzy clustering with fruits. You have decided that you want to group fruits based on two conditions. First is sweetness, and second is color. You have four fruits: an apple, an orange, a pear, and a pineapple.
Apple is extremely sweet and red; orange is moderately sweet and orange in color; pear is extremely sweet and green; and last, pineapple is sweet and yellow.
Using fuzzy clustering, we assigned a degree of membership to each fruit. As you can observe, the apple is associated with the extremely sweet fruit group and red fruits. We can group fruits according to it. Fuzzy clustering allows us to consider various features of the fruits and express their memberships to different groups.
5. Model-Based Clustering
Model-Based Clustering is a technique used in data analysis to find groups or clusters in a dataset. Instead of assuming a specific shape for the clusters, it takes a more flexible approach. It assumes that the data points in a cluster follow a certain probability distribution, like the familiar bell curve. The process involves estimating the parameters of these distributions, such as the average and spread.
The Expectation-Maximization (EM) algorithm is often used for this estimation, going back and forth between refining cluster assignments and improving the distribution models. The Bayesian Information Criterion (BIC) helps determine the best number of clusters.
For example, consider a dataset of customer purchase behaviors. Model-Based Clustering can be applied to identify distinct segments of customers based on their buying patterns. The algorithm estimates the underlying distribution of each segment, allowing businesses to tailor marketing strategies to specific customer preferences and behaviors.
Why is Clustering Required in Data Mining?
Clustering in data mining is essential for several reasons:
Pattern Identification: Clustering helps identify patterns or groups within large datasets, revealing inherent structures and relationships among data points.
Data Summarization: It simplifies the complexity of datasets by grouping similar data points, making it easier to understand and analyze.
Anomaly Detection: Clustering aids in detecting outliers or anomalies by highlighting data points that do not conform to the patterns of their assigned clusters.
Data Compression: It can compress large datasets by representing them with cluster prototypes, reducing the storage space needed.
Decision Making: Clustering assists in decision-making processes by providing insights into the natural groupings present in the data.
What kinds of classification is not considered a cluster analysis?
Hierarchical classification is not considered a form of cluster analysis. In hierarchical classification, data points are organized into a tree-like structure based on their similarities. This structure is often represented as a dendrogram. While both clustering and hierarchical classification involve grouping similar items, they differ in their approach.
In clustering, the goal is to create distinct groups without a predefined hierarchy, whereas hierarchical classification explicitly arranges data points in a hierarchical order.
Frequently Asked Questions
What are some challenges that occur while using clustering algorithms?
Some challenges include determining the optimal number of clusters and dealing with outliers and noise becomes challenging.
What are some applications of clustering?
Some clustering applications are customer segmentation, image segmentation, and social media networking analysis.
What's the purpose of identifying outliers in clustering?
Identifying outliers in clustering helps detect unusual or abnormal data points that differ significantly from the regular patterns. It helps enhance cluster quality and delivers insights into possible data issues.
What happens when there is noise in clustering?
When there is noise in clustering, it can disrupt the clustering process by introducing misleading or irrelevant patterns. If noise is present in the dataset, it can affect the quality and decrease the clustering performance.
What are the various clustering methods?
Different types of clustering include Partitioning, destiny-based, distribution model-based, hierarchical, and fuzzy clustering.
Conclusion
In this article, we will discuss what clustering is in data mining. We even explore what you mean by cluster and how it works. we learn about different clustering techniques like Partitionary Based Method, Density Based Method, Hierarchical Method, Fuzzy Clustering and model based clustering. We even learn about applications of clustering through this article. Do check out the link to learn more about such topic


 8+ registered

