Do you think IIT Guwahati certified course can help you in your career?
Introduction
In the study of probability and statistics, Covariance and Correlation are two important mathematical terms frequently used. Both of them describe the relationship between two variables.
Covariance
The Covariance of two variables is a measure of their relationship. The metric evaluates how much – and how far – the variables change together. In another way, it's a measure of the variance between two variables. On the other hand, the metric does not consider the dependency among variables.
It's the relationship between two random variables in which a change in one causes a difference in the other.
It's used to represent a linear relationship between two variables.
It specifies the direction of the relationship among variables.
Covariance is measured in units. Its units are calculated by multiplying the units of the two variables.
The Covariance can take any value between -infinity to +infinity, where a negative value indicates a negative relationship and a positive value shows a positive relationship.
Positive Covariance: Positive Covariance occurs when two variables move in the same direction.
Negative Covariance: When two variables are moving in opposite directions.
Formula for Covariance
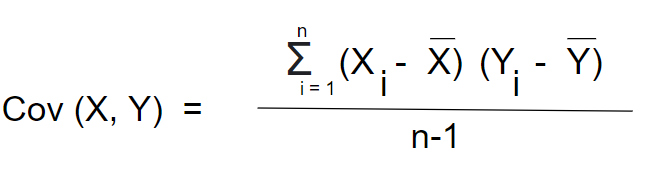
The Covariance of two variables, X and Y, can be calculated using the following formula
for population
2. for Sample
Here,
x̄ and ȳ = mean(average) of the given sample set.
n = total number of the Sample (data points).
Xi and Yi = individual samples of the set(values of X and Y variable).
Correlation
The strength of the relationship between variables is measured by Correlation. The scaled measure of Covariance is a Correlation. It has no dimensions. In other words, a Correlation coefficient is always a pure number that isn't expressed in any units.
It shows if and how strongly two variables are connected.
Correlation ranges from -1 to +1, with values near +1 indicating a strong positive Correlation and around -1 indicating a strong negative Correlation.
Here, the variables are indirectly related to each other.
It indicates the direction of the link between variables and the strength of the relationship among them.
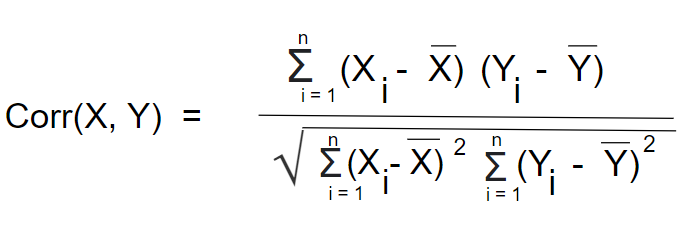
Formula for Correlation
Here,
x̄ and ȳ = mean(average) of the given sample set.
n = total number of the Sample (data points).
Xi and Yi = individual samples of the set(values of X and Y variable).
Covariance versus Correlation
Covariance
Correlation
The Covariance of two random variables measures how much they vary together.
Correlation is a statistical term that measures the degree to which two variables are related.
Lie between -infinity to +infinity
Lie between -1 to +1
A Measure of Correlation
The scaled version of Covariance
has dimensions
dimensionless
dependent on the scale of the variable
independent of the scale of the variable
involving the connection between two variables or data sets
involving the connection between multiple variables as well
The relationship between Covariance and Correlation can be expressed using the formula below:
Here,
Cov(X, Y): the Covariance between the random variables X and Y.
Corr(X, Y): the Correlation between X and Y.
σX: the standard deviation of X.
σY: the standard deviation Y.
Frequently Asked Questions
1. What is the relation between Covariance and Correlation? Covariance and Correlation are two opposite terms used in statistics and regression analysis. Covariance shows how the two variables differ, whereas Correlation shows how the two variables are related.
2. Does Covariance have a unit? Covariance, unlike the Correlation coefficient, is measured in units. The units are calculated by multiplying the units of two variables. Variance can be positive or negative.
3. What is Covariance? The Covariance of two variables shows how they are related to one another. In more technical terms, Covariance measures how two random variables in a data set will change together. It can lie between -infinity to +infinity.
Conclusion
In this article, we learned about Covariance and Correlation. These are two important terms used in statistics and regression analysis.
The Covariance of variables is a measure of their relationship. The metric evaluates how much – and how far – the variables change together. It lies between -infinity and +infinity.
Correlation is a statistical term that measures the degree to which two variables are related. It shows if and how strongly two variables are connected. It lies between -1 and +1. Check out this problem - First Missing Positive
Explore more!
Use Coding Ninjas Studioto practice various questions asked in multiple interviews. It will assist you in mastering effective coding techniques, and you will also getinterview experienceswith people working in big companies.


 9+ registered

