Role of a Data Analyst
A data analyst uses programming skills to analyze and fetch relevant information out of large amounts of complex data. Basically, an Analyst derives meaning from messy data. A Data analyst needs to have the following skills:
- Programming skills: Sound knowledge of programming is required for analyzing Data in SQL, R, Python, etc. While working in python, one must be aware of the right libraries that can be used to get results efficiently.
- Statistics: Statistical knowledge is very helpful to derive meaning from data.
- Machine learning: With help of machine learning algorithms we can find structure in data which is helpful in drawing insights and deriving meaningful conclusions.
- Data Visualization: A Data analyst must have great data visualization skills, in order to summarize and present data
- Presentation skills: An analyst needs to communicate their observations to a stakeholder. They need to link all relevant observations and meaningfully present it to the client.
- Critical thinking: It’s required to analyze structure and linkages within a Data set. Moreover, it’s necessary for interpreting data and drawing conclusions.
The work of a data analyst involves working with data throughout the data analysis pipeline. The primary steps in data analysis are data mining, data management, statistical analysis, and data presentation.
- Data mining involves the extraction of data from unstructured data sources which may include written text, complex databases, raw data. Extract, Transform, Load (called ETL) converts raw data into a useful and manageable format. Data mining is usually the most time-consuming step in the data analysis pipeline.
- Data Management or warehousing is another important part of a Data Analyst’s job which involves designing databases that allow easy access to the results of data mining.
- Both Statistical and machine learning techniques are used by analysts to reveal trends and draw insights from the data. The model prepared, can be applied to new data to make predictions for informed decision making. Statistical programming languages like R or Python (pandas) are necessary for this process.
- Mostly the final step in data analysis is the presentation, where the insights are shared with the stakeholders. The use of Data Visualization tools is highly recommended as compelling visuals can help in showing the correlations in data and help listeners understand the importance of insights.
You might also want to explore the IIT Data Analytics Course to give your career a competitive advantage.
Data Analysis using Python
Below, I am going to walk you through some libraries in python which are very helpful for Data Analysis.
Numpy & Pandas are your two evergreen friends on this journey. Both of these libraries are extremely important and the logic developed while studying these two libraries is also helpful in various other languages like SQL.
- Numpy: Numpy is a widely-used Python library. By using NumPy, you can speed up your tasks and interface with other packages present in the Python ecosystem, like scikit-learn, which uses NumPy under the hood. Almost every data analysis or machine learning package for Python leverages NumPy in some way. You may want to have a look at Numpy's official website to explore some interesting stuff going on with Numpy!
- Pandas: Pandas might be lazy animals. But Pandas in python is one of the most actively used libraries. It provides extended data structures to hold different types of data. Pandas make Data analysis in python very flexible by providing functions for operations like merging, joining, reshaping, concatenating data, etc. You may want to have a look at Pandas’s official website to explore some interesting stuff going on with Pandas!
Below is an example to walk you through the simple application of these libraries :
import pandas as pd
import numpy as np

x1 = np.array(['a', 'a', 'b', 'b', 'b'])
x2=np.array([50, 250, 100, 400, 350])
x3=np.array([10, 20, 20, 50, 40])
x4=np.array([2, 3, 1, 4, 3])
df1 = pd.DataFrame({'bucket':x1,'quantity':x2, 'risk':x3, 'weight':x4})
df1

You can also try this code with Online Python Compiler
Output:
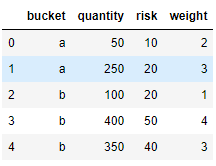
We have a simple table with 4 columns (one nominal and three numerical)
Let's try to solve below-mentioned problems:
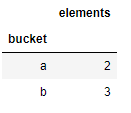
- The number of elements as a new col 'elements'.
- The weighted average of qty and risk, as columns Wtd_AVG_QTY and Wtd_AVG_RISK.
df1.groupby('bucket').agg({'bucket': len}).rename(columns={'bucket': 'elements'})
You can also try this code with Online Python Compiler
df1.groupby('bucket').apply(lambda g: np.average( g.quantity, weights=g.weight)).to_frame('W_AVG_QTY')
You can also try this code with Online Python Compiler
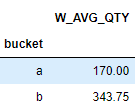
This can also be done by sum(weight*quantity)/ sum(weight).
EXPLORING DATA
Moving ahead, we’ll learn how to gather data, visualize it, and make sense out of it.
- Matplotlib: Matplotlib is the most popular plotting python library. It’s an amazing visualization library in python for 2D plots of arrays. Matplotlib is a viable open-source alternative to MATLAB. Developers can also use matplotlib’s APIs to embed plots in GUI applications. You may want to have a look at Matplotlib's official website to explore some interesting stuff going on with Matplotlib!
- Seaborn: This is another plotting library built on top matplotlib and is more versatile.It provides a high-level interface for drawing attractive and informative statistical graphics. You may want to have a look at Seaborn's official website to explore some interesting stuff going on with Seaborn!
If you don’t have any of these libraries installed, you can do it with a simple “pip install library_name” command in your terminal.
You can also check out Data Analyst vs Data Scientist here.
Frequently Asked Questions
Which analytical tools are used in Data Analytics?
Most of the Data analysts use business intelligence software such as Tableau, programming languages such as SQL, R, Python, which have various visualization and statistical libraries.
What is exploratory data analysis?
EDA or Exploratory data analysis is a process in which the researcher will conduct initial investigations on data to discover patterns, to spot anomalies, to check assumptions, and hypotheses with the help of statistics and graphical representations. EDA is not a strict process, but a ‘philosophy’, whereby researchers try to get the ‘feel’ of the data, often using their own judgment to discover what the most important elements are.
Data analysts vs. Data scientists
Data analysts focus on answering specific questions and focus more on model creation and other routine tasks whereas Data scientists concentrate on producing broader insights and focus more on business needs, strategic oversight, and deep learning.
Conclusion
This brings us to the end of this article, where we have explored Data Analysis, types of analysis performed on Data, and How to analyze data using Python. I hope you are clear with all the material that has been provided in this article. I would highly recommend getting some hands-on practice on the above topics so as to get more clarity about Data analysis and all the tools that are required.I hope this article was helpful.


 8+ registered

