Do you think IIT Guwahati certified course can help you in your career?
Introduction
In today's world, everyone collects vast amounts of information from various sources. However, extracting meaningful insights from this data is challenging, mainly when stored across multiple systems or in different formats. Data blending in Tableau helps in such a condition. Tableau is a famous data visualization and analytics tool. It offers a "Data Blending" feature allowing users to analyze data from different sources.
This blog will explore data blending in Tableau, its benefits, and how to leverage it effectively to gain deeper insights.
What is Data Blending in Tableau?
Data blending is a well-known technique used to combine data stored in multiple sources for analysis and visualization. It helps users extract and blend data from databases, excel sheets, or cloud-based platforms without complex transformations. Data blending in Tableau provides a platform for exploring relationships and patterns by merging data from various sources.
In data blending in Tableau, we take two data sources; primary data source and secondary data source. The primary data source is the one we are currently working on, and the secondary data source contains the additional relevant data that needs to be merged with data in the primary data source.
Steps to Implement Data Blending
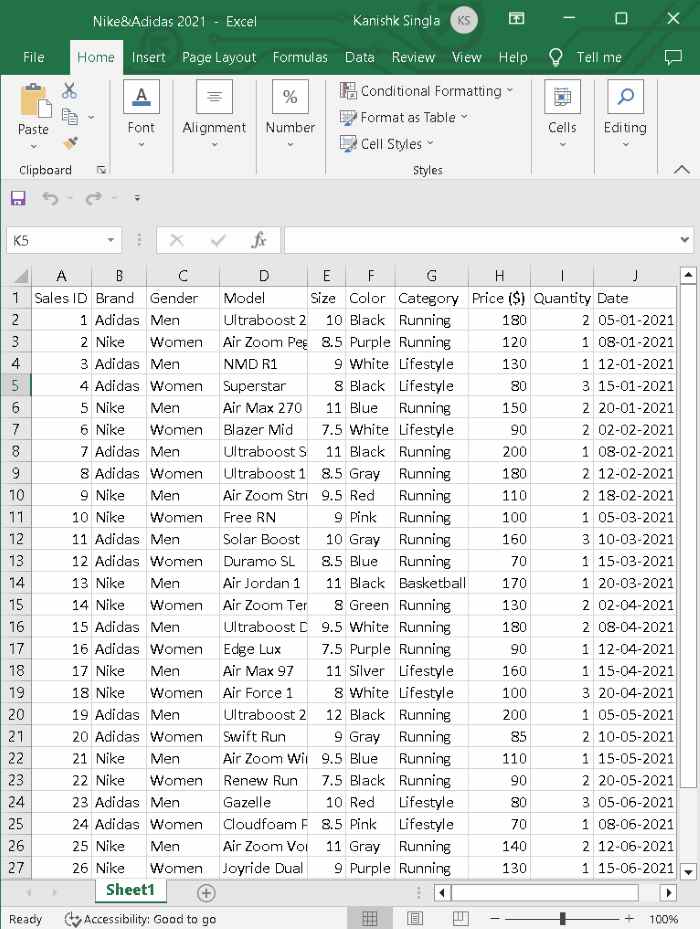
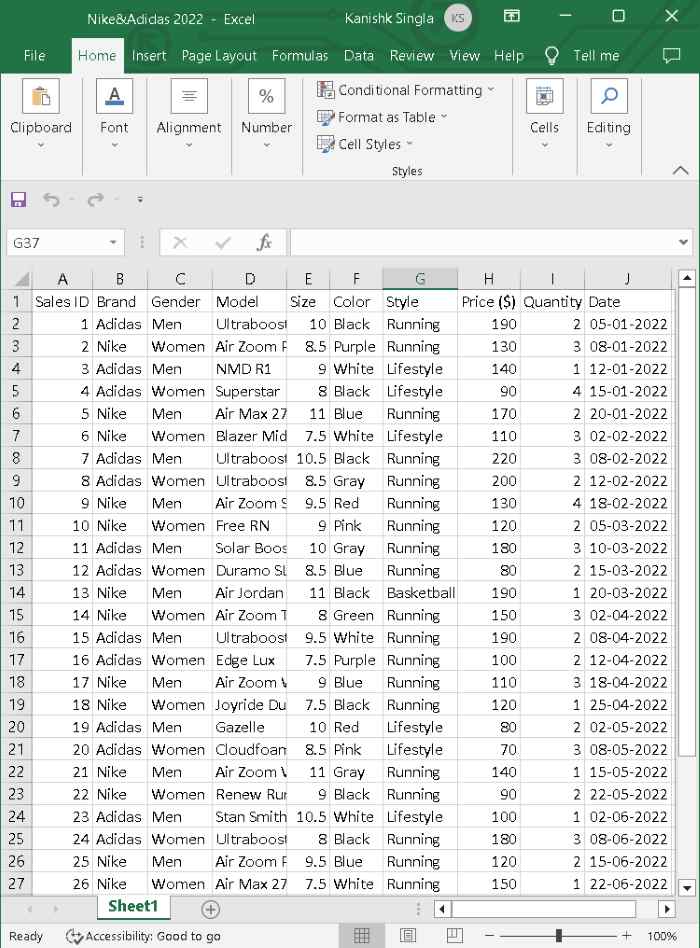
Let us understand the data blending in Tableau with the help of one example. We will blend two data sets containing information on Nike and Adidas sports shoe sales in 2021 and 2022. The number of fields and model types is the same in both sets, but the sales quantities may differ.
Hence, data blending helps establish relationships between two relevant data sources, making data analysis more meaningful and insightful. We can compare two data sets more efficiently by blending them in a Tableau worksheet.
Below are the two data sets.
Dataset 1 ( named Nike & Adidas 2021)
Dataset 2 ( named Nike & Adidas 2022)
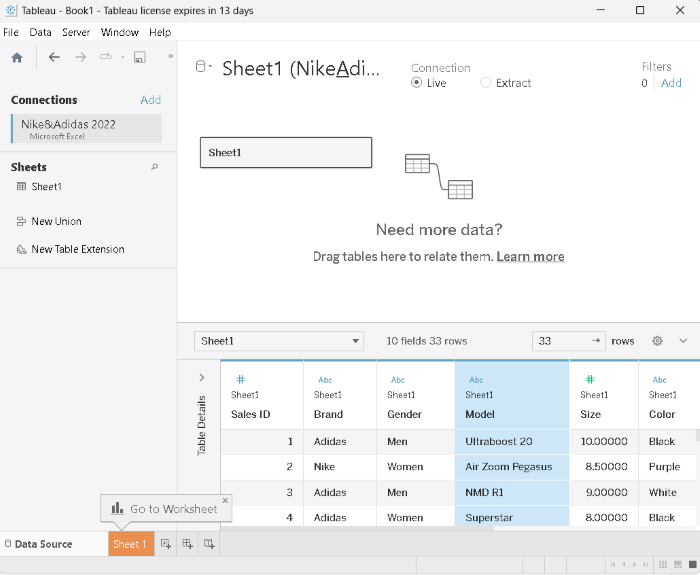
Step 1: Add the first dataset as shown below.
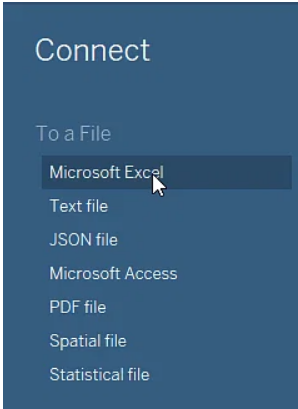
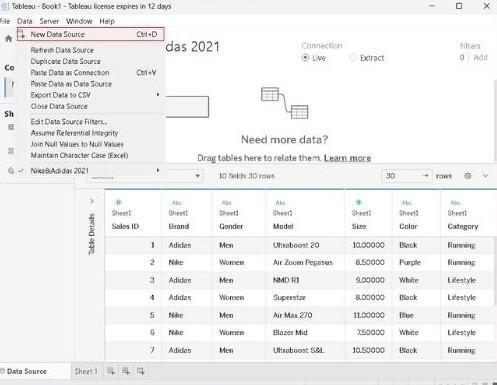
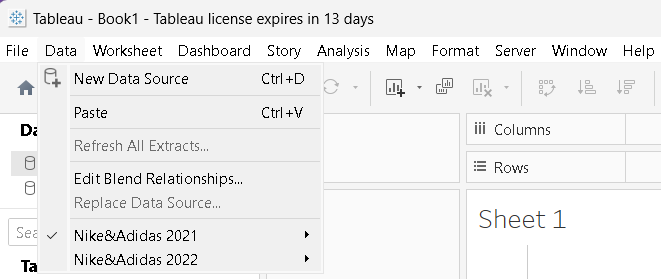
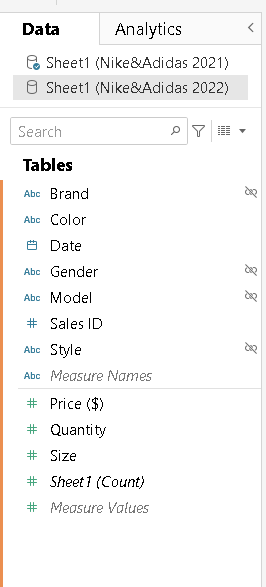
Step 2: Now add these data sources in Tableau. After adding the first data source, you can add the second data source. Go to the Data tab and select New Data Source, or use the shortcut Ctrl + D.
Note: The fields present in the data source are also shown in the above image. If you have applied any function on any column, it might show extra columns. You can right-click and hide the not required columns.
Step 3: After adding the data sources, go to the worksheet.
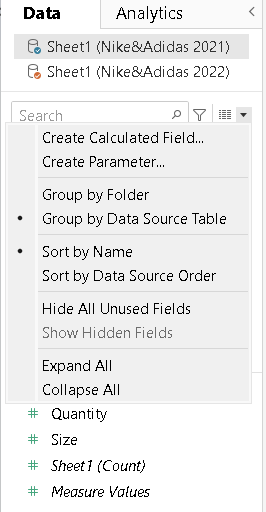
Step 4: We go to the Data tab and select the Edit Blend Relationships option to see the existing relationship between these two data sets and make new relationships.
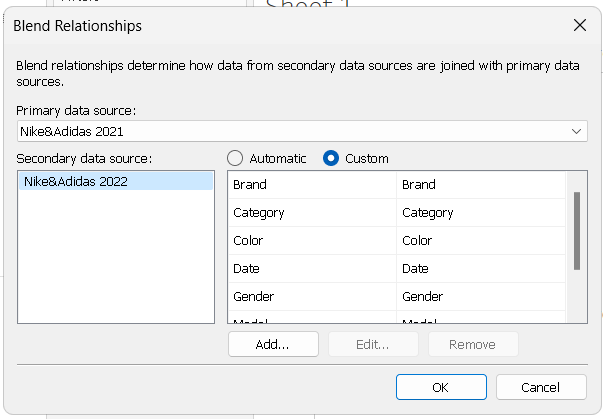
Step 5: A Relationship dialog box will open where you can edit the primary and secondary sources, showing the list of automatically detected relationships between the fields.
We can change the Automatic option to Custom to add new relationships. In our case, in the table "Nike&Adidas 2021", the column named Category stores the type of shoe. Whereas, in the "Nike&Adidas 2022," the column having the same information is named Style.
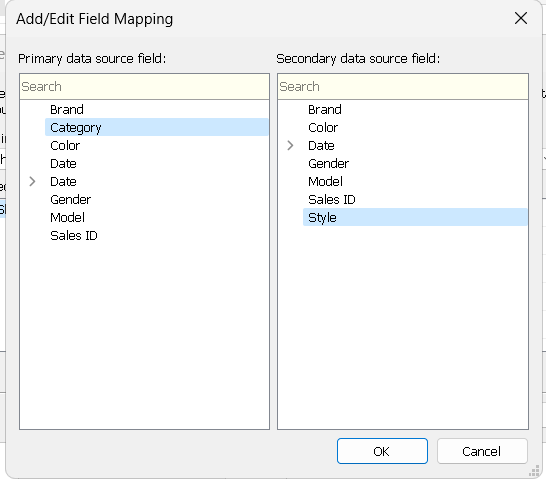
Step 6: You can add, edit, and remove any relationship. We will create a relation between the fields Category and Style from the two tables. To do this, we select the Custom option and click on Add.
Click OK, and this will create the relationship between Category and Style.
The link icon is in front of the linked fields between both tables. You can use these fields from the primary data set as a common field because they are linked.
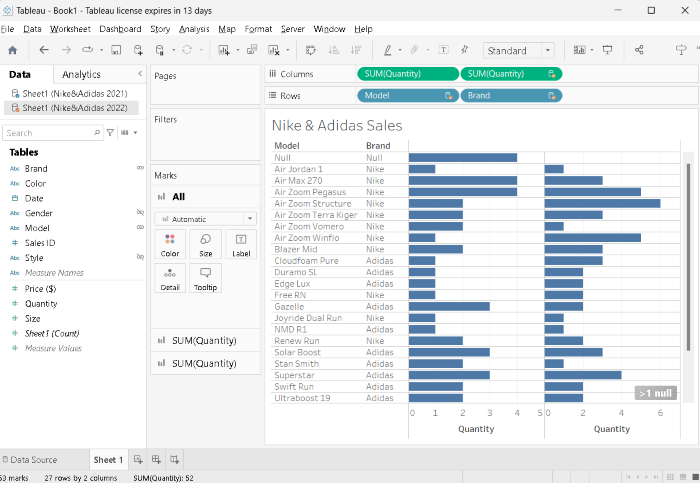
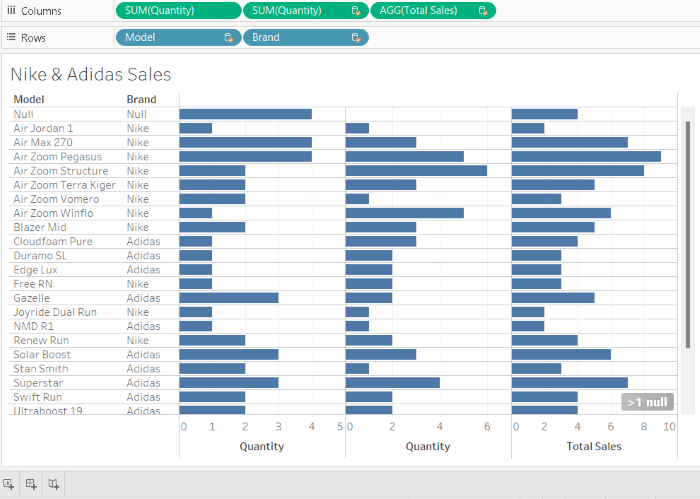
Step 7: As you can see in the image below, we made a bar graph for the total sales of Nike & Adidas in 2021 and 2022. Because of data blending, we got model-wise sales data for both years in one graph. You can drag and drop any field you want to analyze in Columns and Rows section.
Step 8: As you can see, one NULL value is present in the graph. Your graphs might have more NULL values; we create a new calculated field and write a formula to eliminate these.
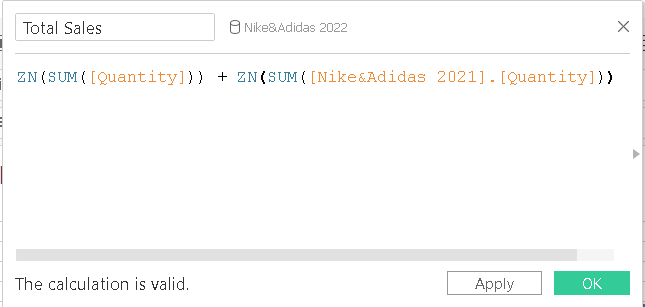
Let’s create a formula that shows the total sales over 2 years.
Step 9: You can see the newly created field named Total Sales in the measures section. Drag that into the columns section, and you can instantly see the freshly generated visualization with combined sales.
Benefits of Data Blending in Tableau
Let’s discuss some of the benefits of data blending in Tableau.
Data blending helps users combine multiple data sources into a single platform. It allows for unified analysis and eliminates the need to switch between different tools or platforms.
It eliminates the need for extra preparation and effort. Tableau can quickly connect and easily blend data sources, reducing time and cost.
Blending data from different sources enables analysts to uncover deeper insights and make more informed decisions. By integrating relevant data, Tableau users can discover relationships, perform advanced calculations, and create custom metrics that were impossible with individual datasets alone.
Limitations of Data Blending
While data blending in Tableau offers numerous benefits, it's essential to be aware of its limitations. Let's see some limitations of Data Blending in Tableau.
Some compatibility issues can be due to differences in data formats, connectivity options, or unsupported data types. In these cases, the user needs to consider alternative methods for data preparation.
Data blending from different sources and sizes can also impact performance. Large datasets or complex blending methods may result in slower query response times and increased memory consumption.
When blending data from multiple sources, it's essential to consider data security. Data from different sources may have varying sensitivity levels, access restrictions, or compliance requirements. Consider these factors to avoid data breaches or non-compliance issues.
It is a must to always aggregate data in calculations from secondary data sources. We might also face issues using non-additive aggregates like MEDIAN, COUNTD, etc.
How is Data Blending Different from Joins?
Data Blending and Joins are techniques used to merge data from multiple sources, but they differ in their approach and purpose. The below table shows the key differences between data blending in Tableau and joins.
Data Blending
Joins
In Blending, we aggregate and then combine the data.
In Join, we first combine and then aggregate the data.
It is used when working with data from different sources or databases.
It is used when the data comes from the same source or database.
It executes only the left Join.
It has the ability to execute all different types of Joins.
It is used in the case of duplicate data.
Adding data columns across similar rows can cause data loss or duplication.
It performs aggregations and calculations on blended data.
It combines rows without additional calculations.
It is more complex.
It is straightforward and efficient.
It is performed using special data visualization tools like Tableau.
Data blending in Tableau is a technique of combining data from multiple sources or databases within Tableau. It allows users to blend and analyze data from different databases, files, or cloud-based sources in a single Tableau workbook.
How does data blending differ from data joining in Tableau?
Data blending in Tableau lets you merge data from different sources without a strict relationship or common field. It aligns data based on similar dimensions or attributes. In contrast, data joining in Tableau involves combining data based on shared keys or in the same databases.
What are the other features of Tableau?
Some other features in Tableau are data visualization, a drag-and-drop interface, advanced analysis, and data blending. It also provides data connectors and some collaboration tools for sharing and publishing dashboards.
Conclusion
We expect this article was insightful and that you learned something new today. In this blog, we learned about data blending in Tableau. Data Blending is a powerful method to extract and analyze data from multiple sources. Tableau is a software used for data blending. We also discussed the benefits and limitations of data blending in Tableau, as everyone should know about them. In the end, we saw its implementation with the help of some data sources.
If you want to learn more about Tableau, do visit.


 8+ registered

