Dropping Columns or Rows with missing values
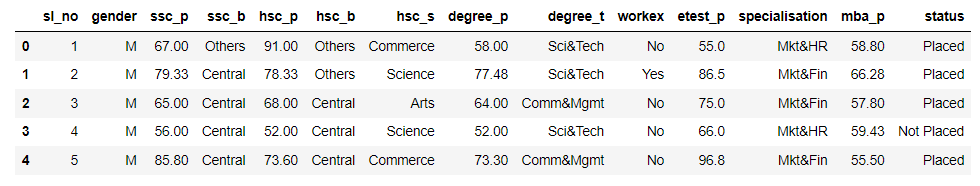
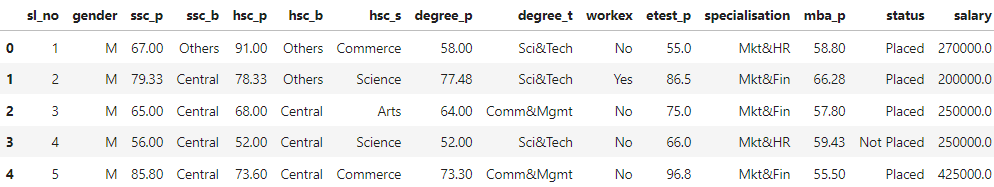
Sometimes, some columns have missing values, and there is usually nothing we can do about it because either the column of type string, date, object, or any non-numeric value. In such cases, we could drop that row. When we have a lot of rows, and we know that deleting a few rows won’t affect the output, we can drop the rows. Moreover, we can drop the whole column if it is not relevant for making predictions or does not correlate with any other dataset features. We saw earlier that the Salary column has null values. If the Salary column is not relevant to you, you can drop the whole column. However, you can just drop the rows with NaN values if the column is needed.
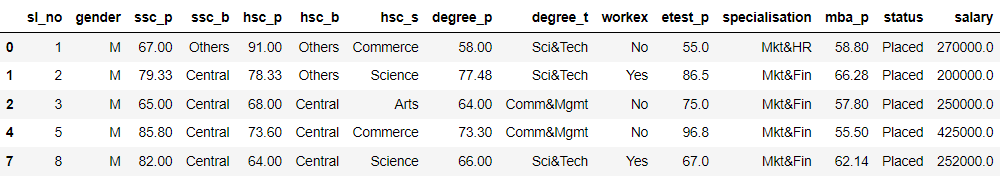
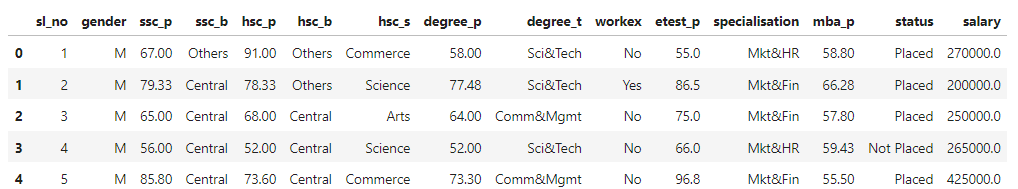
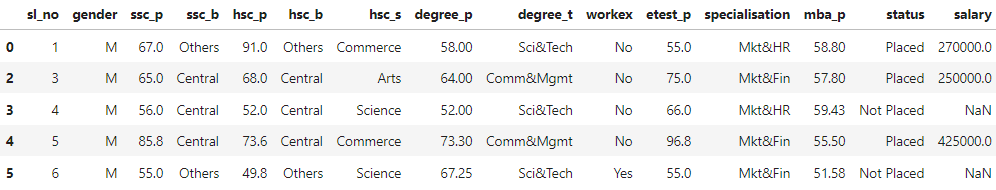
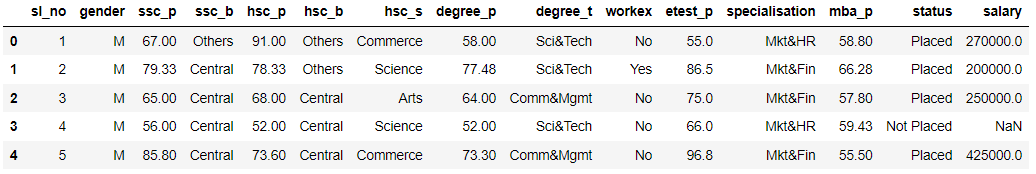
#handling NaN values by dropping column
df_after_dropping_nan_column=placement_df.dropna(axis=1)
print(df_after_dropping_nan_column.head(5))

You can also try this code with Online Python Compiler
#handling NaN values by dropping rows
df_after_dropping_nan_rows=placement_df.dropna() print(df_after_dropping_nan_rows.head(5))
You can also try this code with Online Python Compiler
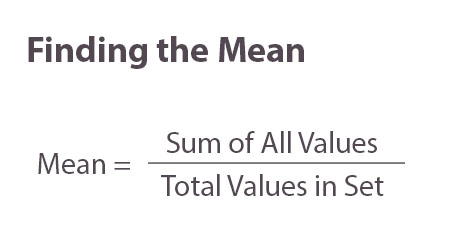
Filling missing values with mean
As discussed earlier, when the data distribution is skewed, using the mean to fill missing values is not a good decision. However, if a dataset doesn’t have outliers, you can use the column’s mean to fill the NaN values.
Source
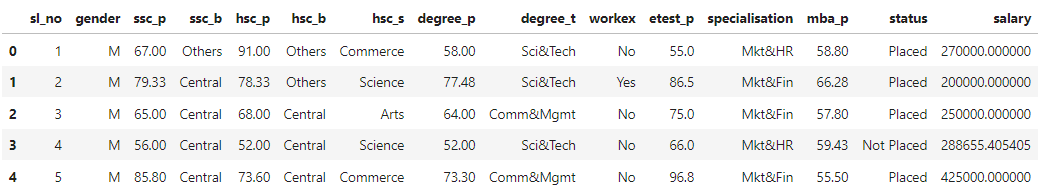
#filling null values with mean
placement_df_mean=placement_df.copy()
placement_df_mean["salary"]=placement_df["salary"].fillna(placement_df["salary"].mean())
print(placement_df_mean.head(5))
You can also try this code with Online Python Compiler
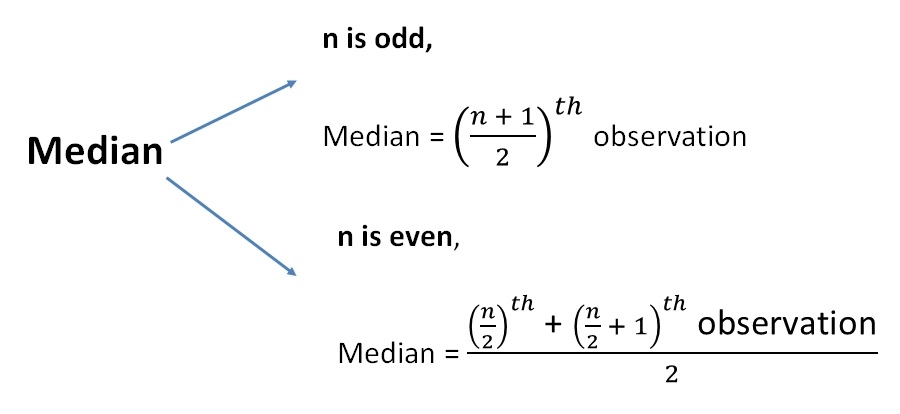
Filling missing values with the median
Using this technique to handle the missing values in data cleaning is a good option for skewed data distribution when dealing with numerical data.
Source
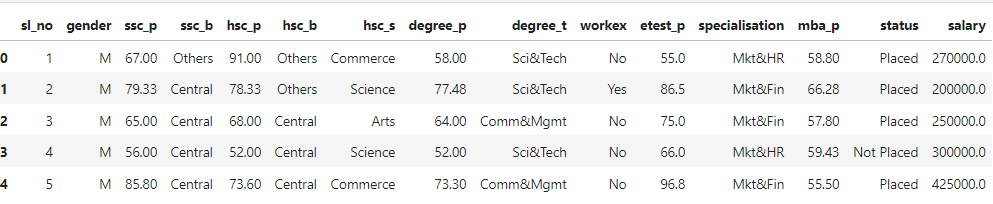
#filling null values with median
placement_df_median=placement_df.copy()
placement_df_median["salary"]=placement_df["salary"].fillna(placement_df["salary"].median())
print(placement_df_median.head(5))
You can also try this code with Online Python Compiler
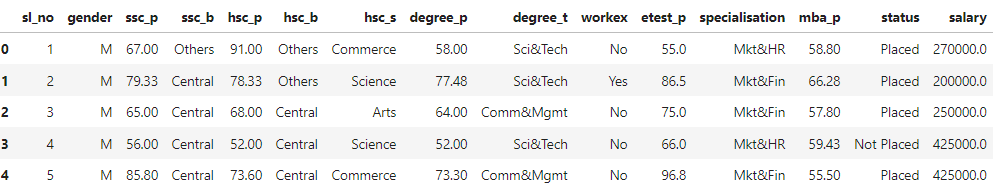
Filling missing values using the mode
When the data distribution is skewed, the mode is an excellent choice to replace the missing values. Replacing the NaN values with the data with the highest frequency in the salary column is a great alternative to using the median.
#filling null values with mode
placement_df_mode=placement_df.copy()
placement_df_mode["salary"]=placement_df["salary"].fillna(placement_df["salary"].mode()[0])
print(placement_df_mode.head(5))
You can also try this code with Online Python Compiler
Filling the missing values with values that come before or after them
When observations have some logical order, replacing the NaN values with those before or after them in the column is a good substitute.
placement_df_bfill=placement_df.copy()
# replace all NA's the value that comes directly after it in the same column,
# then replace all the remaining na's with 0
placement_df_bfill["salary"]=placement_df["salary"].fillna(method='bfill', axis=0).fillna(0)
placement_df_bfill.head(5)
You can also try this code with Online Python Compiler
placement_df_ffill=placement_df.copy()
# replace all NA's the value that comes directly before it in the same column,
# then replace all the remaining na's with 0
placement_df_ffill["salary"]=placement_df["salary"].fillna(method='ffill', axis=0).fillna(0)
placement_df_ffill.head(5)
You can also try this code with Online Python Compiler
Removing duplicate rows
We should remove any duplicate rows from the dataset. But first, we need to find the duplicate rows:
#show all the duplicate values as True except for the first
print(placement_df.duplicated(subset=None, keep='first'))
You can also try this code with Online Python Compiler
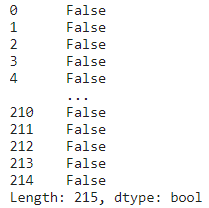
We can see that in our dataset, there are no duplicate rows. Now, let us assume that the first two rows are duplicate, then we can drop the rows using the code below:
#dropping second-row assuming that it is the duplicate of the first row
placement_df_drop_row=placement_df.drop(placement_df.index[[1]])
placement_df_drop_row.head(5)
You can also try this code with Online Python Compiler
Getting relevant or usable form of data from columns
In a dataset, sometimes the values of the features will be stored in a format that you won’t be able to use directly to analyze your data. For instance,
- a feature can have values in the form of an object,
- numbers can be stored in the form of strings,
- date is not stored in datetime format, and so on.
How to deal with it? Let’s look at this with the help of a few examples in code. You can download the CSV file from here.
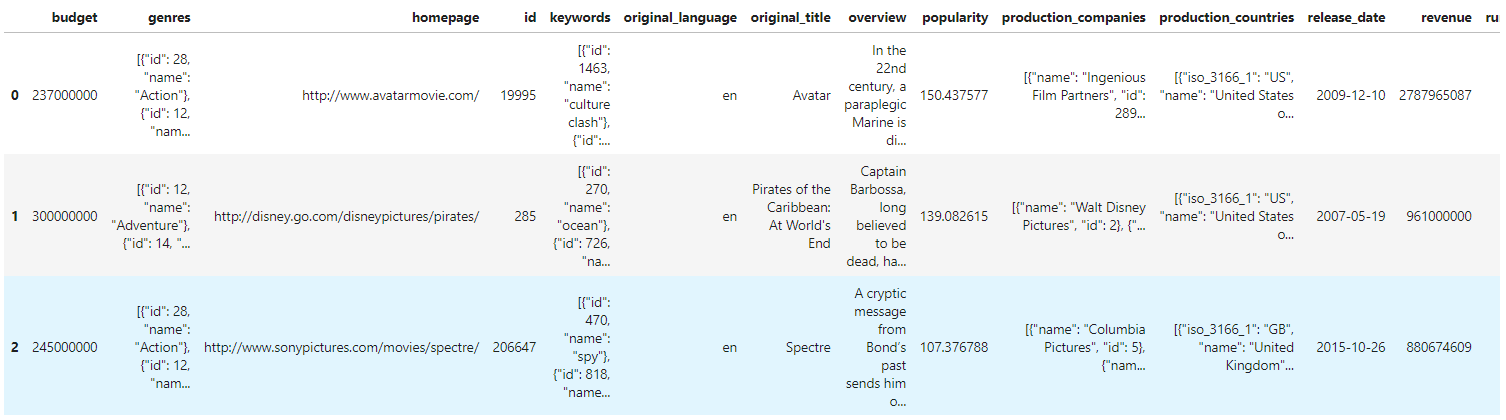
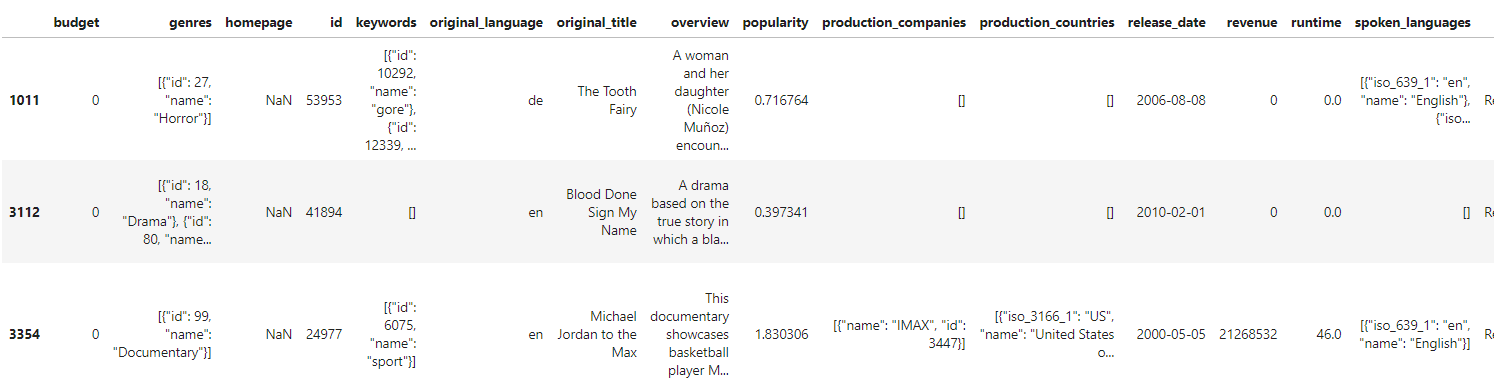
movie_df=pd.read_csv("../input/moviedata/tmdb_5000_movies.csv")
movie_df.head(3)
You can also try this code with Online Python Compiler
Parsing dates
movie_df_copy=movie_df.dropna() #dropping all rows with NaN values
print(movie_df_copy["release_date"].dtypes) #printing the datatype of date
You can also try this code with Online Python Compiler

We want to convert the release_date column from object to datetime64[ns] type so that we can easily access the day, month and year.
##making a new column with datetime64[ns] type
movie_df_copy['parsed_release_date'] = movie_df_copy['release_date'].astype('datetime64[ns]')
print("Datatype of parsed_released_date column")
print(movie_df_copy['parsed_release_date'].dtypes) #printing the datatype
print("Day:")
print(movie_df_copy['parsed_release_date'].dt.day.head(5))
print("Month:")
print(movie_df_copy['parsed_release_date'].dt.month.head(5))
print("Year:")
print(movie_df_copy['parsed_release_date'].dt.year.head(5))
You can also try this code with Online Python Compiler
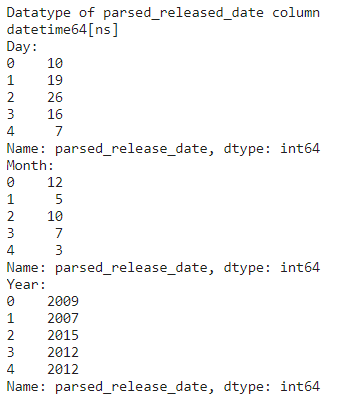
Now, if we want, we can save the day, month, year in separate columns of the data frame and then use it to make analyzing the data convenient.
Converting string to object
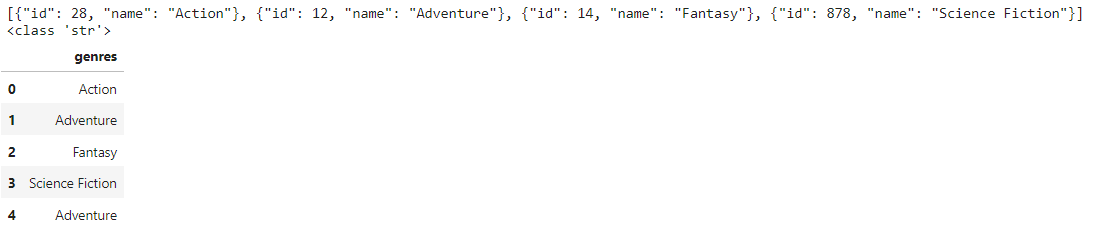
The genres column stores values in a string of array of objects format. Usually, we would like to work with only the genre name to analyze the dataset. To get just the genre names, we code the following:
import json #importing json
print(movie_df["genres"][0]) #printing the first entry in genres column
print(type(movie_df["genres"][0])) #printing the datatype of genres entry
genre_arr=[]
for json_obj_arr_str in movie_df["genres"]:
    genre_obj_arr=json.loads(json_obj_arr_str) # converts the string to array of json objects
    for j in range(len(genre_obj_arr)):
        genre_arr.append(genre_obj_arr[j]["name"]) #getting just the name of the genre
genre_df=pd.DataFrame(genre_arr, columns = ['genres']) #making dataframe for all the genres
genre_df.head(5)
You can also try this code with Online Python Compiler
Apart from these, the data may be stored in formats that won’t be convenient to use. Sometimes there could be different formats for the same column. So, parsing the data or converting it to a usable form is very crucial in data cleaning.
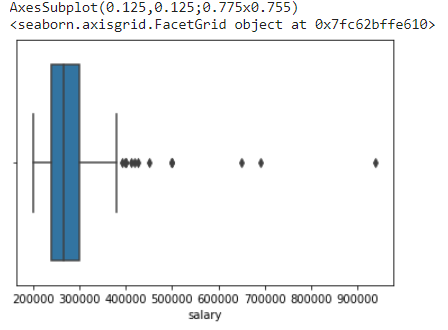
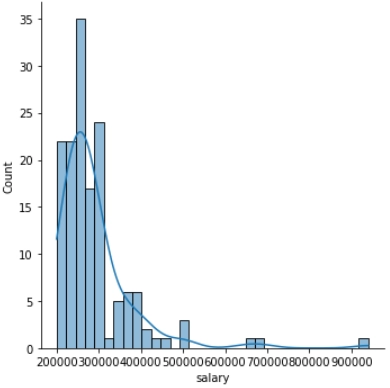
Filtering outliers
Real-world data will always have outliers. Sometimes, these outliers will help us better analyze the data or train our machine learning model. However, the data collected can often be factually wrong, resulting in inaccurate outputs. In such cases, finding the false outliers and removing them is essential in data cleaning.
How do we find these outliers? We can find them using the Seaborn displots and histograms!
sns.displot(x=movie_df["runtime"]) #displot to see the data distribution and outliers
You can also try this code with Online Python Compiler
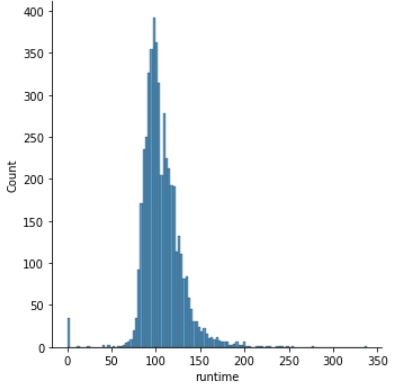
The plot shows that around 40 movies have a runtime of 0 minutes. This is not factually correct.
movie_df[movie_df['runtime']<50].head(3) #output first three movies with runtime less than 50
You can also try this code with Online Python Compiler
We need to remove all the movies with runtime 0 minutes.
movie_df_filtered=movie_df[movie_df["runtime"]>0] #removing wrong outliers
print(movie_df_filtered[movie_df_filtered["runtime"]==0]) #checking if outliers were removed
You can also try this code with Online Python Compiler

Removing inconsistency in data
When people fill survey forms online, some type their name in all capital letters while others fill it with only the first letter in capital. From this survey data, if we try to search for a name, say “Rita”, we won’t be able to find it if it is stored as "rita” or “RITA”. Analyzing such inconsistent data becomes difficult. Thus, we do data cleaning to remove these inconsistencies.
Let’s look at an example of inconsistent data through code. Download the dataset from here.
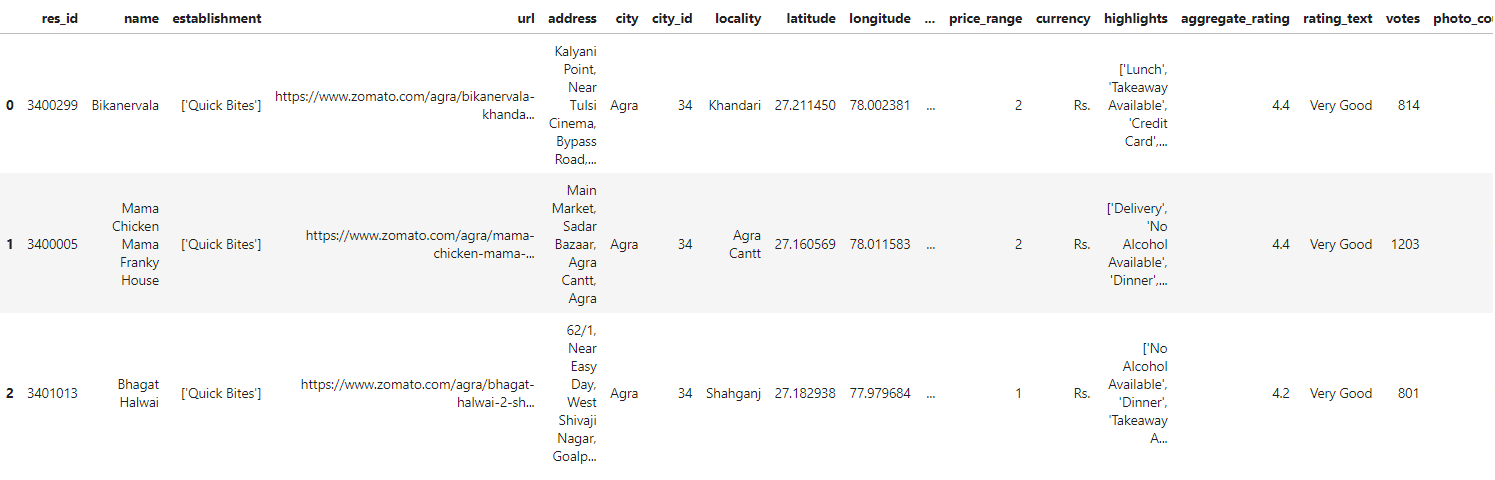
zomato_df=pd.read_csv("../input/inconsistentzomato/zomato_restaurants_in_India_inconsistent.csv")
zomato_df.head(3)
You can also try this code with Online Python Compiler
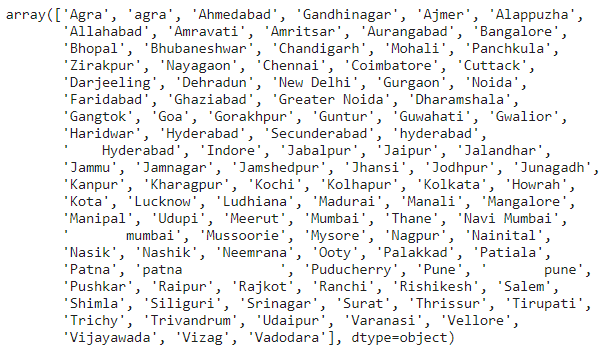
zomato_df["city"].unique()#printing the unique values of city column
You can also try this code with Online Python Compiler
Removing white spaces
We see that there are white spaces in the city names like Mumbai, Pune. Let’s remove it:
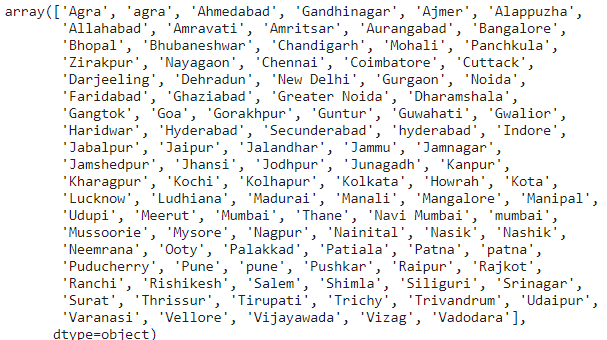
#removing whitespaces from the city names
zomato_df_letter=zomato_df.copy()
zomato_df_letter["city"]=zomato_df_letter["city"].str.strip()
zomato_df_letter["city"].unique()
You can also try this code with Online Python Compiler
Removing capitalization inconsistencies
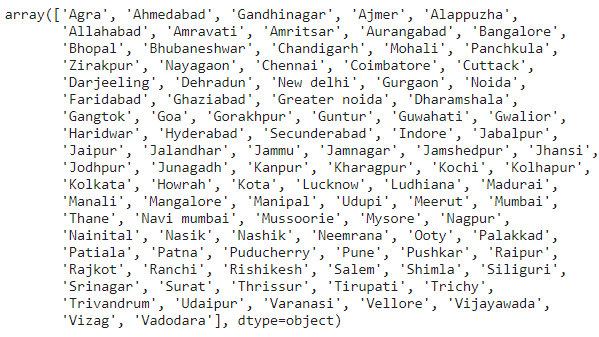
Looking at the unique values, we find cities like Agra have inconsistent capitalization. Let’s correct it:
# Lower case cities column
zomato_df_letter['city'] = zomato_df_letter['city'].str.lower()


# Capitalize first letter
zomato_df_letter['city'] = zomato_df_letter['city'].str.capitalize()
zomato_df_letter["city"].unique()
You can also try this code with Online Python Compiler
Frequently Asked Questions
Is it always necessary to filter outliers?
There will frequently be data that don't appear to fit into the dataset you are studying. If you have a good reason to delete outliers, such as incorrect data entry, doing so will make the data you're working with perform better. The presence of an outlier, on the other hand, can sometimes prove a theory you're working on. Just because an outlier exists doesn't mean it is wrong. Consider deleting an outlier only if it appears irrelevant for analysis or is a mistake.
What may cause data duplication?
Duplicate data are most likely to occur during data collection. Duplicate data can be created when you integrate data sets from numerous sources, scrape data, or get data from clients or multiple departments.
What are the various validity constraints?
Validity constraints are:
- Data types constraints: values in a column must be of a specific datatype, such as boolean, numeric, or date.
- Range Constraints: Numbers or dates should typically fall within a specific range.
- Mandatory Constraints: Some columns can't be left blank.
- Unique Constraints: Within a dataset, a field, or a combination of fields, must be unique.
- Set-Membership constraints: A column's values are drawn from a collection of discrete values. A person's gender, for example, can be male or female.
- Foreign-key constraints: A foreign key column can't have a value that doesn't exist in the referenced main key, just like in relational databases.
- Text fields that must follow a specific pattern are known as regular expression patterns. Phone numbers, for example, may be required to follow a specific pattern.
- Validation across fields: specific conditions must be met across numerous fields. The date of discharge from the hospital, for example, cannot be earlier than the date of admission.
Conclusion
In this article, we learned about data cleaning. We learned how to handle missing values in the dataset, remove redundant data, bring consistency to the data, filter outliers and convert the data into a usable form. We learned how vital data cleaning is to make analyzing the data easier.
Check out this problem - Duplicate Subtree In Binary Tree
Refer to our guided paths on Coding Ninjas Studio to upskill yourself in Data Structures and Algorithms, Competitive Programming, JavaScript, System Design, and many more! If you want to test your competency in coding, you may check out the mock test series and participate in the contests hosted on Coding Ninjas Studio! But if you have just started your learning process and are looking for questions asked by tech giants like Amazon, Microsoft, Uber, etc; you must have a look at the problems, interview experiences, and interview bundle for placement preparations.
Nevertheless, you may consider our paid courses to give your career an edge over others!
Do upvote our blogs if you find them helpful and engaging!
Happy Learning!


 8+ registered

