Get a skill gap analysis, personalised roadmap, and AI-powered resume optimisation.
Introduction
Data mining is the process of analyzing and discovering patterns, trends, and relationships in large volumes of data using various statistical and machine-learning techniques. It involves extracting knowledge from data to gain insights and make informed decisions.
Studying data mining can give you a valuable skill set that can be applied in various industries and professions. It can also help you develop critical thinking and problem-solving skills, which can benefit many areas of life.
What is Data Mining?
Data mining is finding useful patterns and insights from a large volume of datasets, typically through various techniques from statistics, Machine learning, and Artificial Intelligence. The main objective of data mining is to extract valuable knowledge from large amounts of data and transform it into a more easy-to-understand structure for further use.
Data mining involves several steps, including data cleaning, integration, selection, transformation, data mining, pattern evaluation, and knowledge representation. These steps are iterative and interactive, as the results of one step can influence the following steps and the entire data mining process.
Some standard techniques used in data mining include clustering, classification, association rule mining, regression analysis, and anomaly detection. These techniques can be applied to a wide range of data types, such as structured data (e.g., databases), unstructured data (e.g., text), and semi-structured data (e.g., XML).
The insights gained from data mining can be used in various applications, such as business intelligence, fraud detection, healthcare, and social media analysis. Data mining is valuable for extracting practical knowledge and insights from large datasets.
History of Data Mining
The history of data mining can be found back in the 1960s and 1970s when statisticians and mathematicians started to develop algorithms and techniques for extracting useful information from large datasets
However, in the 1990s, data mining emerged as a distinct field with the creation of powerful computers and the growth of the internet. In the early 1990s, a group of researchers at IBM developed the first data mining tool, the Intelligent Miner, used to analyze large datasets from the financial industry
In the early 2000s, data mining began to merge with other related fields, such as machine learning and artificial intelligence, leading to the development of more sophisticated algorithms and techniques
Today, data mining is a mature and rapidly growing field with various applications across various industries. With the emergence of big data and the continued development of artificial intelligence, data mining will likely remain a critical tool for understanding and making sense of large datasets in the future
Why learn Data Mining?
There are multiple reasons to learn Data Mining, and the reason may vary from person to person. Some of the common reasons are:
To gain insights from large data sets: Data mining enables you to extract valuable insights from large datasets that may not be immediately available. By applying Data mining techniques, one can uncover new patterns, trends, and relationships that can help make more informed decisions
To improve decision-making: With the help of data mining techniques, one can make more informed decisions that are backed by data rather than intuition or guesswork. This can help you have better decisions about everything from product development to marketing to customer services
To identify opportunities: Data mining can help to identify new insights that may not have otherwise been considered. By analyzing data from a variety of sources, one can find the trends and patterns that can help capitalize on emerging opportunities
To increase efficiency: Data mining can help one identify inefficiencies and bottlenecks in one’s business processes, allowing them to streamline operations and improve efficiency
To stay competitive: In today's data-driven world, companies that refrain from using data mining techniques risk falling behind their competitors. By learning data mining techniques, one can stay ahead of the competition and use data to their advantage
How Data Mining Works
The process of data mining is to extract information from a large volume of datasets. It is done in four phases:
Data acquisition: It is the process of collecting, filtering, and cleaning the data before it is added to the warehouse
Data cleaning, preparation, and transformation: It is the process in which data is cleaned, preprocessed, and transformed after adding it to the warehouse
Data analysis, modeling, classification, and forecasting: In this step, data is analyzed with the help of various models, and classification is done
Final report: In this step, the final report, insights, and analysis are finalised
The Data Mining Process
Data mining requires domain knowledge, technical skills, and creativity to extract essential insights from giant data sets. The steps and techniques used in the process can vary depending on the data and the specific problem being solved. There are multiple steps involved in the process of data mining:
Data collection: The first step in data mining is collecting relevant data from various sources. This can include data from databases, spreadsheets, websites, social media, sensors, and other sources
Data preprocessing: When the data is collected, it must be preprocessed. This involves cleaning the data, removing duplicates, and dealing with missing data
Data exploration: The next step is to identify patterns, trends, and relationships. This can be done using various visualization techniques such as scatter plots, histograms, and box plots
Data transformation: In this step, the data is transformed into a format suitable for analysis. This can involve normalization, discretization, or other techniques
Data modeling: In this step, various algorithms and methods are used to build a model that can be used to extract insights from the data. This can include clustering, classification, regression, or other procedures
Model evaluation: Once the model is built, it must be evaluated to determine its efficiency. This involves testing the model on a subset of the data and comparing the results to known outcomes
Deployment: Finally, the model is deployed for a real-world problem, and the insights gained from the data mining process are used to make informed decisions
Types of Data Mining
Data mining can be broadly categorized into two types - predictive and descriptive data mining analysis.
Predictive Data Mining Analysis
Predictive data mining analysis is a sort of data mining that involves analyzing historical data to forecast future events or trends. It entails developing models that use various statistical and machine learning algorithms to estimate future events based on trends discovered in previous data. Predictive data mining models can be used to predict a variety of scenarios including anticipating customer behavior, detecting potential fraud, projecting revenue, and estimating the risk of a disease appearing in a specific group.
Predictive data mining frequently involves a significant amount of data preparation and preprocessing as well as the selection of relevant algorithms to develop models that can effectively predict future outcomes. Predictive data mining approaches can be further classified into the following categories:
Analysis of Regression
Analysis of classification
Analysis of time series
Descriptive Data Mining Analysis
Descriptive data mining analysis is a sort of data mining that focuses on discovering and comprehending the underlying patterns and relationships in a dataset. Unlike predictive data mining descriptive data mining is focused on summarizing and displaying data to acquire insights into its structure and properties rather than making predictions about future events.
Descriptive data mining techniques are frequently used for exploratory data analysis, discovering patterns and relationships in data and gaining a better understanding of the data's underlying distribution. Descriptive data mining approaches can be further classified into the following categories:
Analysis of clusters
Analysis of summarization and visualization
Mining is governed by an association
Mining for sequential patterns
Applications of Data Mining
Data mining has a wide range of applications across different industries. Here are some of the most common applications of data mining:
Customer Relationship Management: Data mining is used in customer relationship management (CRM) to analyze customer data and identify patterns and trends in customer behavior. This can help businesses better understand their customers and develop more effective marketing and sales strategies
Fraud Detection: Data mining is used in fraud detection to identify unusual patterns and anomalies in data that may indicate fraudulent activity. This can help businesses to detect and prevent fraudulent transactions, such as credit card fraud and identity theft
Healthcare: Data mining is used in healthcare to analyze patient data and identify patterns and trends in patient behavior and treatment outcomes. This can help healthcare providers to develop more effective treatment plans and improve patient outcomes
Market Research: Data mining is used in market research to analyze customer data and identify patterns and trends in customer behavior and preferences. This can help businesses to develop more effective marketing and sales strategies and stay ahead of the competition
Predictive Analytics: Data mining is used in predictive analytics to identify patterns and trends in data that can be used to make predictions about future events or outcomes. This can help businesses to make more informed decisions and anticipate future trends and developments
Financial Analysis: Data mining is used in financial analysis to analyze financial data and identify patterns and trends in financial markets and investment performance. This can help investors to make more informed investment decisions and manage risk more effectively
Sports Analysis: Data mining is used in sports analysis to analyze player and team data and identify patterns and trends in player performance and team dynamics. This can help coaches and managers to make more informed decisions and develop more effective game strategies
Association in Data Mining
Association in data mining identifies relationships between items in a dataset. This technique is commonly used in market basket analysis to identify which items are frequently purchased together. The output of association mining is a set of rules that indicate the strength of the association between items.
Support and Confidence: Support calculates the frequency with which an item set appears in the dataset. It is calculated as the ratio of transactions that contain a particular item to the total number of transactions in the dataset. While confidence measures the strength of a rule between two items. It is the ratio of the number of transactions that contain both the previous and consequent of the rule to the number of transactions that contain only the antecedent
A-priori algorithm: Apriori algorithm is used in data mining to discover frequent items in large datasets. It is an unsupervised learning algorithm that is commonly used for market basket analysis to identify items that are frequently purchased together. The algorithm works by generating a set of items and then pruning the item that does not meet the minimum support threshold
FP Growth algorithm: The FP-Growth algorithm is a popular algorithm used to discover frequent items in large datasets. It is an unsupervised learning algorithm that works by building a compact data structure called an FP-tree to represent the transactional database and then recursively mining the tree to generate frequent itemsets
Clustering in Data Mining
Similarity and distance measure: Similarity and distance measures are important concepts in data mining and are used to measure the similarity or dissimilarity between objects or data points. These measures are commonly used in clustering, classification, and recommendation systems. Basically, similarity measure is a method of calculating how the data samples are related to each other. A dissimilarity measure is used to figure out how much the data objects are distinct
Partitioning methods:Partitioning Methods are one of the most widely used clustering techniques in data mining. It involves dividing a dataset into several non-overlapping partitions, with each partition representing a cluster. There are several partitioning methods in data mining:
K-Means & Medoids: The k-means algorithm partitions the dataset into k clusters, where k is a pre-defined number. The algorithm starts by randomly selecting k centroids and assigning each point in the dataset to the nearest centroid. The centroids are then recalculated as the mean of the points assigned to them, and the process is repeated until the centroids no longer change or the maximum number of iterations is reached. Medoids is another variation of the k-means algorithm, where instead of using the mean of the points, the representative point of each cluster is selected as the point that minimizes the average distance between it and all other points in the cluster
Hierarchical: Hierarchical clustering involves creating a hierarchy of clusters by recursively dividing or merging clusters based on a similarity measure. The two main types of hierarchical clustering are agglomerative (bottom-up) and divisive (top-down). In agglomerative clustering, each data point initially forms its own cluster, and then pairs of clusters are successively merged based on a distance metric until a single cluster containing all the data points is obtained. In divisive clustering, all data points initially belong to a single cluster, and clusters are successively divided into smaller clusters based on a distance metric until each data point is in its own cluster
Density-Based: Density-based clustering involves identifying regions of high density in the dataset and partitioning the data points into clusters based on these regions. Density-based clustering algorithms are particularly useful when the clusters are of arbitrary shape and size. The two most widely used density-based clustering algorithms are DBSCAN (Density-Based Spatial Clustering of Applications with Noise) and OPTICS (Ordering Points To Identify the Clustering Structure)
Classification Techniques
Classification is a data mining technique that involves identifying the class or category to which an object or observation belongs. It is a supervised learning method which uses a set of labeled training data to create a predictive model which can be used to classify new or unseen data. Features or attributes are the characteristics of the data that are used to determine its class or category. In classification, features are the variables or attributes that are used to predict the class label of the target variable. Some examples of features in data mining include:
Numeric features: These are numerical variables such as age, income, and temperature
Categorical features: These are variables that represent categories, such as gender, race, or type of product
Binary features: These are variables that take on one of two possible values, like yes or no, true or false, or 0 or 1
Text features: These are variables that represent text data, such as customer reviews or product descriptions
Image features: These are variables that represent visual data, such as pixel values in an image
Time-series features: These are variables that represent data collected over time, like stock prices or weather data
Geospatial features: These are variables that represent spatial data, such as latitude and longitude or elevation
Types of Classification
Decision tree induction: Decision tree induction is a popular classification technique in data mining that uses a tree-like model to represent decisions and their possible consequences. It is a supervised learning method that builds a decision tree from a set of training data to predict the class label of new data instances. Let's see an example:
Outlook
Temperature
Activity
Sunny
Hot
Don't play
Rainy
Cold
Don't play
Sunny
Mild
Play
Rainy
Mild
Play
The decision tree for this kind of data set would be:
Bayesian Classification: Bayesian classification is a statistical method used to classify data into different classes based on the probability of each class. In this approach, the classifier computes the probability of each class given a set of input features, using Bayes' theorem. It assumes that the features are independent of each other and estimates the probabilities of each class based on the probability distribution of the features. Bayesian classification is commonly used in text classification, image recognition, and other applications. For example, in text classification, a Bayesian classifier might be trained to classify news articles into different categories, such as sports, politics, or entertainment, based on the words that appear in the article. The classifier would compute the probability of each category given the words in the article and assign the article to the category with the highest probability.
Bayesian Belief Networks(BBNs): They are graphical models that represent the relationships between variables and their probabilities. A BBN consists of a set of nodes, each representing a random variable, and directed edges connecting the nodes, representing the conditional dependencies between the variables. Each node has a conditional probability table (CPT) that specifies the probability of that node given the values of its parents. BBNs can be used for various tasks, such as classification, prediction, and decision-making under uncertainty. They are particularly useful when dealing with complex problems that involve multiple variables and uncertain relationships between them. For example, in medical diagnosis, a BBN could be constructed to represent the relationships between symptoms, diseases, and test results. The BBN would allow the system to reason about the likelihood of different diseases, given the observed symptoms and test results, and provide a diagnosis with a degree of certainty.
3. Lazy Learners: Lazy learners refer to machine learning algorithms that do not generalize the training data to construct a model. Instead, they memorize the training data and use it as a reference to make predictions on new instances. Lazy learners do not require the computational overhead of training models, and they can be faster than eager learners that construct a model based on the training data. One example of a lazy learner is the k-Nearest Neighbor (k-NN) algorithm. In k-NN, the algorithm simply stores the entire training dataset in memory and uses it to make predictions on new instances. When a new instance is presented to the algorithm, it finds the k closest instances in the training set based on some distance metric and predicts the class of the new instance based on the class labels of the k nearest neighbors.
4. Rule-based classification: Rule-based classification is a data mining technique that uses a set of if-then rules to classify new instances. Here's an example of how rule-based classification can be used in practice:
Suppose we have a dataset of patients with different medical conditions, and we want to develop a rule-based classifier to predict whether a patient has diabetes based on their symptoms. The dataset includes the following variables: age, sex, BMI, blood pressure, cholesterol level, and glucose level. To develop a rule-based classifier, we would first divide the dataset into a training set and a test set. We would use the training set to generate a set of if-then rules that predict whether a patient has diabetes based on their symptoms. Here's an example of a rule that could be generated: If glucose level >= 126 AND BMI >= 25 AND age >= 45. Then the patient is classified as having diabetes. This rule states that if a patient's glucose level is equal to or greater than 126 mg/dL, their BMI is equal to or greater than 25, and their age is equal to or greater than 45, they will be classified as having diabetes. We would generate several such rules based on the training data and evaluate their performance on the test data. If the classifier performs well, we can use the rules to predict whether new patients have diabetes based on their symptoms.
Prediction Techniques
Predictive Data Mining is the analysis performed to forecast a future event, other data, or trends, as the name 'Predictive' means to forecast anything. Predictive Data Mining can help business analysts make better decisions and contribute to the analytics team's efforts. Predictive Data Mining assists in Predictive Analytics. As we all know, predictive analytics is the use of data to forecast outcomes.
Linear Regression Techniques
Linear regression is used to model the relationship between a dependent variable and one or more independent variables. Linear regression can be used for both supervised and unsupervised learning tasks
In supervised learning, linear regression is used for regression tasks where the goal is to predict a continuous numerical value. For example, predicting the price of a house based on its size, location, number of bedrooms, etc. In this case, linear regression can be used to find the best-fitting line or hyperplane that predicts the house price based on the given features
In unsupervised learning, linear regression is used for dimensionality reduction tasks. For example, in principal component analysis (PCA), linear regression is used to find the principal components that capture the most variance in the data. Linear regression can also be used for clustering tasks, where the goal is to group similar data points together based on their features
There are several techniques used to estimate the parameters of a linear regression model, including ordinary least squares (OLS), maximum likelihood estimation (MLE), and gradient descent. These techniques are used to find the best-fitting line or hyperplane that minimizes the sum of squared errors between the predicted values and the actual values of the dependent variable
Non-Linear Regression Techniques
Non-linear regression is a statistical technique used to model the relationship between a dependent variable and one or more independent variables when the relationship is non-linear. In non-linear regression, the model can take on various functional forms, such as quadratic, exponential, logarithmic, sigmoidal, etc., depending on the nature of the data.
Here are some examples of non-linear regression techniques:
Polynomial Regression: Polynomial regression is a non-linear regression technique that models the relationship between the dependent variable and the independent variable as an nth-degree polynomial function. It is used to capture complex, non-linear relationships between the variables. For example, a quadratic equation can be used to model the relationship between a person's age and income
Exponential Regression: Exponential regression is a non-linear regression technique that models the relationship between the dependent variable and the independent variable as an exponential function. It is used to model growth or decay processes, such as population growth or radioactive decay. For example, the growth of a bacteria population over time can be modeled using an exponential function
Logarithmic Regression: Logarithmic regression is a non-linear regression technique that models the relationship between the dependent variable and the independent variable as a logarithmic function. It is used to model data that exhibits a logarithmic trend, such as the relationship between the number of years of education and a person's income.
Orange for Data Mining
Orange is a powerful platform for data analysis and visualization, data flow, and productivity. It is an open-source data mining tool and includes the end of visual programs for fast quality data analysis for testing and interactive data display.
You need to download and install orange from this site to work with orange. Follow the following steps to set up a workflow.
Step 1: Open Orange software
When you open orange, the first thing you will see is a welcome screen. The welcome screen provides options to start a new data analysis, open a recent one or explore tutorials.
Step 2: Exit the welcome screen
Let's exit the welcome screen. Orange starts with a blank canvas, and the left side of the window contains various widgets. Widgets are computational units of orange; they read the data, process it, visualize it, do clustering, build predictive models and otherwise help you explore the data.
Step 3: Load file widget
The workflow of most of the data analysis begins with the file widget. The file widget helps to load our data. To load it on the canvas, click on the icon, and it will appear on the canvas.
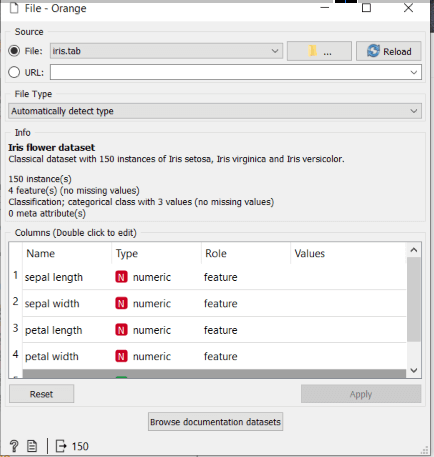
Step 4: Load the file in the file widget
Double click the icon to open the file widget and browse documentation sets and load one of the existing data files that come with orange, or you can load your data.
Step 5: Load the data table widget
Now, the data table widget needs to be loaded on the canvas to see what data has been selected. To load this widget, click on the widget, and it will appear on the screen.
Step 6: Connect file widget to data table widget
Widgets can communicate with one another with the help of their input channel and output channel.
Drag the line from the file widget right output side to the data table widget left input side, as shown in the image. Click the data table widget, and you will see the data you have loaded in the file widget.
Step 7: Load scatter plot widget
You can also plot the data by simply using a scatter plot widget. It will display all your data scatter plots.
Congratulations, you have just set up your first workflow with all the above steps.
Advanced Mining Applications
Mining Data Streams
Data stream mining is the process of analyzing data that arrives in a continuous and rapid stream. For example, social media updates, sensor data, or network traffic. It involves real-time analysis of data as it is generated, using algorithms that can handle high-volume, high-velocity, and high-variety data. It includes online learning, incremental clustering, sliding window analysis, and sketch-based algorithms. Machine learning techniques, such as decision trees, neural networks, and support vector machines, can also be used for data stream mining.
Applications of data stream mining include real-time monitoring of social media sentiment, predicting traffic congestion, detecting network intrusions, and optimizing online advertising. However, data stream mining poses challenges related to the high volume and velocity of data, the need for fast and efficient algorithms, and the potential for concept drift and data imbalance.
Mining Time Streams
Time series mining is the process of analyzing data that is collected over time to identify patterns, trends, and relationships. It is used in many different fields, including finance, healthcare, meteorology, and manufacturing, to make predictions, improve decision-making, and optimize operations. It includes statistical methods, such as time series analysis, autoregressive integrated moving average, and exponential smoothing, as well as machine learning methods, such as artificial neural networks, decision trees, and support vector machines.
Applications of time series mining include forecasting stock prices, predicting patient outcomes in healthcare, detecting anomalies in sensor data, and optimizing manufacturing processes. However, time series mining also poses challenges related to the complexity and variability of time series data, the need for domain-specific knowledge, and the potential for overfitting and bias.
Web Mining
Web mining is the process of extracting valuable information from the World Wide Web by analyzing the content of web pages, the structure of the web, and the usage of the web. It involves data mining techniques to identify patterns, trends, and relationships within large datasets of web data. It has numerous applications in different fields, such as e-commerce, marketing, social media analysis, and personalized recommendations. It enables organizations to understand user behavior, improve customer experience, and gain insights into market trends. However, web mining also raises concerns about privacy and security and ethical issues related to the collection and use of user data.
Retail: Retailers use data mining to analyze customer transactions to discover patterns and trends that can be used to improve customer loyalty and increase sales. For example, a retailer might use data mining to discover that customers who buy a specific product also tend to buy another product, allowing the retailer to make recommendations to customers based on their buying habits
Healthcare: Healthcare providers use data mining to analyze patient data to discover patterns and relationships that can help diagnose diseases and build treatment plans. For example, a healthcare provider might use data mining to find that patients with specific symptoms are more likely to develop a particular disease, allowing the provider to create a screening program to catch the disease early
Finance: Financial institutions utilize data mining to analyze customer data to discover patterns and trends that can be used to detect fraud and improve risk management. For example, a financial institution might use data mining to learn that customers who make large cash withdrawals are more likely to be victims of fraud, allowing the institution to implement additional security measures to protect these customers
Advantages of Data Mining
Data mining offers several advantages to help businesses and organizations make better decisions and gain valuable insights. Here are some of the main advantages of data mining:
Predictive analysis: Data mining allows businesses to predict future trends and behaviors based on historical data. This enables organizations to make better decisions about future strategies, products, and services
Improved marketing: Data mining helps businesses identify customer behavior and preference patterns. This can help organizations create targeted marketing campaigns and personalized offers that are more likely to resonate with customers
Improved customer experience: Data mining can help businesses understand customer preferences and behaviors, enabling organizations to tailor products and services to meet their needs. This can result in higher customer satisfaction and loyalty
Competitive advantage: Data mining enables businesses to gain insights into their competitors' strategies and performance. This can help organizations identify areas where they can earn a competitive advantage and differentiate themselves in the marketplace
Increased efficiency: Data mining can help businesses streamline processes and operations by identifying inefficiencies and bottlenecks. This can help organizations optimize workflows and reduce costs
Fraud detection: Data mining can help detect fraudulent activities and patterns in financial transactions. This can help organizations prevent financial losses and maintain the integrity of their operations
Disadvantages of Data Mining
Data mining has several disadvantages, which can impact its effectiveness and reliability. Here are some of the main disadvantages of data mining:
Cost: Data mining can be expensive, as it requires significant computing power and resources to analyze large datasets. Small businesses or organizations with limited budgets may need help implementing data mining
Complexity: Data mining is a complex process that requires specialized knowledge and expertise. Analyzing large and complex datasets can be challenging, and it may require a team of data scientists to develop and implement effective data mining techniques
Bias and inaccuracies: Data mining can uncover biased or discriminatory patterns if the data used in the analysis is biased or incomplete. This can lead to incorrect or unfair conclusions and decisions
Ethical concerns: Data mining raises ethical concerns about the use of personal data and privacy issues. Organizations must be transparent about their data collection and use practices and ensure that they comply with relevant laws and regulations
Over-reliance on technology: Data mining can lead to an over-reliance on technology, which may result in a lack of human judgment and intuition. Human interpretation and analysis are essential to ensure that data mining results are accurate and meaningful
Data quality: Data mining requires high-quality data to produce reliable and valuable results. If the data is incomplete, inconsistent, or of poor quality, the data mining results may not be accurate or valid
Limitations of Data Mining
Data mining is a powerful tool for discovering hidden patterns, trends, and insights in large datasets. However, it also has several limitations that need to be considered when using it:
Limited to available data: Data mining relies on the available data. If the data is incomplete, biased, or of poor quality, the data mining results may not be accurate or valid
Bias in data: Data mining may uncover biased or discriminatory patterns if the data used in the analysis is biased or incomplete. This can lead to incorrect or unfair conclusions and decisions
Difficulty in choosing appropriate algorithms: Many data mining algorithms are available, and choosing the right one for a specific problem can take time and effort. Different algorithms may produce different results; selecting the suitable algorithm can lead to accurate or complete results
Overfitting: Data mining can suffer from overfitting, where the algorithm produces a too-complex model tailored to the training data. This can result in poor performance when applied to new data
Privacy concerns: Data mining involves analyzing large amounts of data, including sensitive information about individuals. This raises privacy concerns, and ethical and legal implications exist for how the data is collected, stored, and used
Interpretation of results: Data mining can uncover patterns and trends, but it may need help to explain why these patterns exist. It is essential to interpret the results carefully and make reasonable conclusions
Careers in Data Mining
Data Mining is a vast field that offers numerous career opportunities across different industries. Here are some of the most popular career options in Data Mining, along with their approximate salaries:
Data Scientist: Data scientists collect, analyze, and interpret large amounts of data to identify patterns and trends. They typically use statistical analysis, machine learning, and data visualization tools to extract insights from data and present their findings to stakeholders. The average salary for a data scientist in the US is around $120,000 per year
Data Analyst: Data analysts collect, clean, and analyze data to identify patterns and trends. They use statistical analysis and data visualization tools to communicate their findings to stakeholders and help inform decision-making. The average salary for a data analyst in the US is around $68,000 per year
Business Intelligence Analyst: Business Intelligence analysts collect and analyze data to support business decision-making. They typically work with data from various sources, such as sales, marketing, and customer data, to identify opportunities for growth and improvement. The average salary for a business intelligence analyst in the US is around $86,000 per year
Data Mining Engineer: Data mining engineers are responsible for designing and implementing data mining algorithms and tools. They work closely with data scientists and analysts to develop and deploy data mining solutions that meet business needs. The average salary for a data mining engineer in the US is around $95,000 per year
Machine Learning Engineer: Machine learning engineers are responsible for designing and implementing machine learning algorithms and models. They work closely with data scientists and analysts to develop and deploy machine learning solutions that can analyze large amounts of data and make predictions based on that data. The average salary for a machine learning engineer in the US is around $112,000 per year
Frequently Asked Questions
What is Data Mining?
Data mining is the process of discovering patterns, trends, and insights from large datasets using statistical and computational methods. It involves extracting useful information from data sets that are too large or complex for human analysts to filter out manually.
What are the three types of data mining?
Data mining is of three types that are, Descriptive, Prescriptive, and Predictive Data mining. Descriptive Data Mining prepares the descriptive information from the data.
Prescriptive Data mining is done to gain the most suitable action. Predictive Data mining takes previous learnings and, with the help of machine learning models, predicts future outcomes.
What are the applications of Web mining?
Web mining has many applications. It is helpful in improving the web search engines' power. This can be done by classifying and identifying web documents and pages, respectively. Web mining further helps in web content, web usage, social media, E-commerce, and web structure mining.
What is data mining in DBMS?
Data mining in Database Management Systems refers to discovering hidden patterns and knowledge from large databases using data mining techniques such as machine learning, statistical analysis, and pattern recognition. It involves the study of large amounts of data to identify valuable insights that can help organizations make better decisions.
Conclusion
This article discussed data mining, its history, how it works, various examples, applications, advantages, and disadvantages. The primary purpose of data mining is to find meaningful patterns and insights in order to help an organization extract valuable information from vast volumes of datasets. I hope this blog helped you gain knowledge about data mining.


 8+ registered

