


Introduction
Thanks to the digital era, data may now be accessed from anywhere on the planet. When we search for a website or a term, we start creating data. Our search preferences, email addresses, and website usage trends are all stored. Every piece adds up to build enormous data, from an intelligent tracker to sensitive information kept on hard discs. Data visualization is very crucial on the IoT dashboard.
Have you ever thought about what happens to this data? For different reasons, all of this data is analyzed and displayed. The information is used to investigate customer requirements, trends, and future demands. Data visualization is a sophisticated way of showing data in graphs and other graphics so that others may understand it. In the same manner, IoT visualization works.
Data processing and visualization are critical components of an IoT dashboard. An Internet of Things dashboard is also known as a web app, a control panel, or a data visualization tool for the Internet of Things. Its primary purpose is to collect data in real-time from various smart devices and convert it into information that humans can understand. The act of transforming data into knowledge is known as data analysis. Many functions, ranging from data retrieval and storage to research, are offered on several IoT cloud platforms. The terms "IoT platforms" and "IoT dashboards" are commonly interchanged. They are not, however, interchangeable.
Let's look at data visualization and analysis and other IoT control panel aspects.
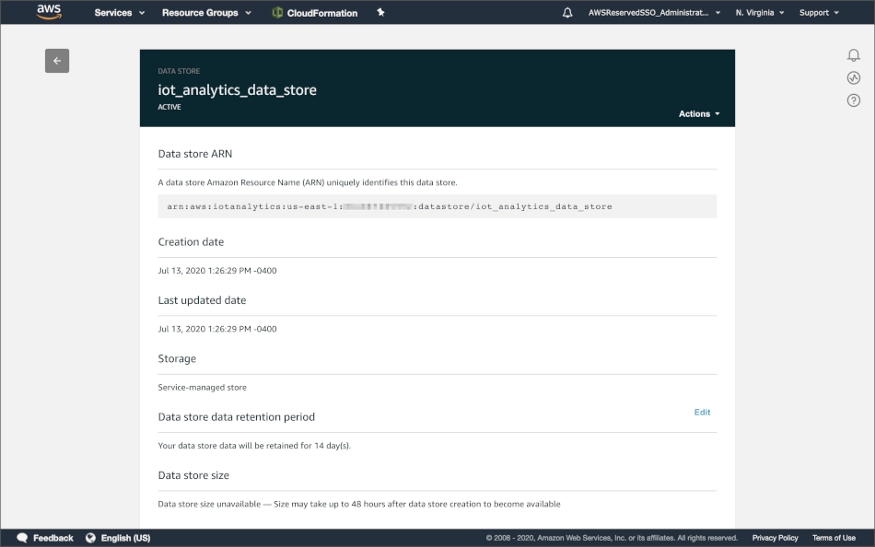
IoT Analytics Datastore
An AWS IoT Analytics Datastore stores prepared data from an AWS IoT Analytics Pipeline in a fully-managed database. Data may be stored in your own Amazon S3 bucket, or an IoT Analytics managed S3 bucket using both Channels and Data storage. We're storing messages in our Datastore using a service-managed S3 bucket in this example.


 8+ registered

