Using System.out.println()
System.out.println() is straightforward to use as the marker to test whether a specific code block is being executed or not. We can also use the print statement to check the variable values. The main benefits of using print statements for debugging in JSP are as follows:
- Since System.out.println() is a part of core Java objects, we can use it anywhere without installing extra classes. This includes JSP, Servlets, RMI, EJB's, classes, ordinary Beans, and Standalone applications.
- System.out.println() statement does not interfere with the execution process of the application, and this feature makes it a beneficial debugging process when the timing is crucial.
Syntax to use for System.out.println().
System.out.println("Debugging statement ”);

You can also try this code with Online Java Compiler
Example Usage:
<%@ taglib prefix = "c" uri = "http://java.sun.com/jsp/jstl/core" %>


<html>
   <head><title>System.out.println Debugging in JSP</title></head>
   <body>
      <c:forEach var = "counter" begin = "1" end = "5" step = "1" >

         <c:out value = "${counter}"/></br>
         <% System.out.println( "counter = " + pageContext.findAttribute("counter") ); %>
      </c:forEach>
   </body>
</html>
You can also try this code with Online Java Compiler
The browser will show the following result on the screen, which can be used for debugging:
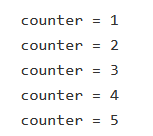
Output
Using the JDB Logger
The J2SE (Java 2 Standard Edition or Java 2 Special Edition) logging framework provides logging services for a class running in the JVM ( Java Virtual Machine ). We can make use of this logging service to debug our application.
Syntax to use for JDK Logger.
logger.info("Debugging Message ");
You can also try this code with Online Java Compiler
Example usage:
<% @page import = "java.util.logging.Logger" %>
<% @taglib prefix = "c" uri = "http://java.sun.com/jsp/jstl/core" %>

<html>
   <head><title>Logger.info Debugging in JSP</title></head>

   <body>
      <% Logger logger = Logger.getLogger(this.getClass().getName()); %>

      <c:forEach var = "counter" begin = "1" end = "5" step = "1" >
      <c:set var = "myCount" value = "${ counter }" />
      <c:out value = "${myCount}"/></br>
         <% String message = "counter = "
            + pageContext.findAttribute("myCount");
            logger.info( message );
         %>
      </c:forEach>
   </body>
</html>
You can also try this code with Online Java Compiler
The above code will produce a similar result as our System.out.println() statement on the browser and in stdout.log. We are using info() method of log because we are logging results for debugging information only. The output produced is as follows:
07-Feb-2022 23:31:31 org.apache.jsp.main_jsp _jspService
INFO: counter = 1
07-Feb-2022 23:31:31 org.apache.jsp.main_jsp _jspService
INFO: counter = 2
07-Feb-2022 23:31:31 org.apache.jsp.main_jsp _jspService
INFO: counter = 3
07-Feb-2022 23:31:31 org.apache.jsp.main_jsp _jspService
INFO: counter = 4
07-Feb-2022 23:31:31 org.apache.jsp.main_jsp _jspService
INFO: counter = 5
We can use Log4J Framework for logging messages in different files based on severity levels and importance.
Using Debugging Tools
This section will learn about different debugging tools provided by the IDE (Integrated Development Environment) like NetBeans. NetBeans is an open-source, free IDE that supports the development of JSP web applications and standalone Java applications. NetBeans also includes a JSP debugger.
NetBeans supports the basic debugging functionalities as listed below:
- Breakpoints.
- Stepping through Code.
- Watchpoints.
Please refer to the documentation to better understand these debugging functionalities.
Using JDB debugger
We can debug JSP applications and servlets with the same JDB commands we use to debug a Java application or an applet.
To debug the JSP application, we can debug sun.servlet.http.HttpServer, and then observe how HttpServer executes the JSP in response to HTTP requests made from the browser.
To get our JDB debugger working for JSP debugging, we need to do a simple setup as listed below:
- Set Our debugger's classpath. This will help us find our JSP and associated classes, basically ROOT\WEB-INF\classes.
Now that we have correctly set up classpaths for JSP, we may set breakpoints wherever we are interested in debugging. And then, use a browser to make an HTTP request to the HttpServer for the JSP (http://localhost:8080/DebugJSP). The execution will stop at the breakpoints, and hence we can debug our application.
Also see : usb debugging
Refer to know about : What is debugging
Frequently Asked Questions
1. What are some other debugging techniques for JSP?
Ans. We can debug our JSP applications in various ways. Some techniques other than the discussed methods are listed below:
- Using Comments.
- Verifying Client and Server Headers.
2. What are various methods to log information in JDB Logger?
Ans. There are various methods to log information in JDB Logger based upon their usage: severe (), warning(), info(), fine(), config(), finer() and finest().
The severe() method is used to log severe information, and the finest() method is used to log the finest information.
3. Mention some important debugging tips?
Ans. Here are some other debugging tips in Debugging in JSP:
-
Ask the browser to show the raw content of the page to display. It can help identify the formatting problems.
- Make sure the browser isn't caching any previous request's output by forcing a full reload of the page.
Key Takeaways
We learned about debugging in JSP using various techniques. We can summarize the whole article as below:
- Debugging in JSP is a process to find errors in the application.
- The most useful debugging Techniques are: Using println statement, Using JDB Logger, Using Debugger tools, Using JDB Debuggers.
- System.out.println() statement is used to trace if a particular code block is executed or not.
- JDB Logger is used for logging information and errors or warnings for the debugging process.
- In NetBeans, we have different debugging tools.
Don't stop here. Check out the blogs Introduction to JSP, JSP - Custom Tags, JSP Architecture and Lifecycle, and JSP Syntax and First App.
We hope you found this blog helpful. Liked the blog? Then feel free to upvote and share it.


 8+ registered

