


Introduction
In this blog, we will learn about various debugging options present in Pyglet. Pyglet is a library for the Python programming language that provides an object-oriented application programming interface for the creation of games and other multimedia applications. Pyglet has no external dependencies or installation requirements which makes it very convenient to use. Also, it facilitates multiple windows and multi-monitor setups which enhances user experience in the aspects of gaming and multimedia. The built-in support in Python for common audio and image formats, sound, music, and video is just exceptional.
Must Recommended Topic, procedure call in compiler design
Debugging Options
A number of debugging options are provided by Pyglet that can be enabled from time to time as per the requirements. Each debug option is in the form of a key in the pyglet.options dictionary. Options can be set directly or indirectly before any other modules are imported.
Environment Variables in each case is the string in uppercase prefixed with PYGLET_. For Example, the environment variable for debug_font will be PYGLET_DEBUG_FONT.
Before going into the depth of debugging, let us have a look at the list of the debugging options provided. Also, the environment variables for each of them is mentioned in the list.
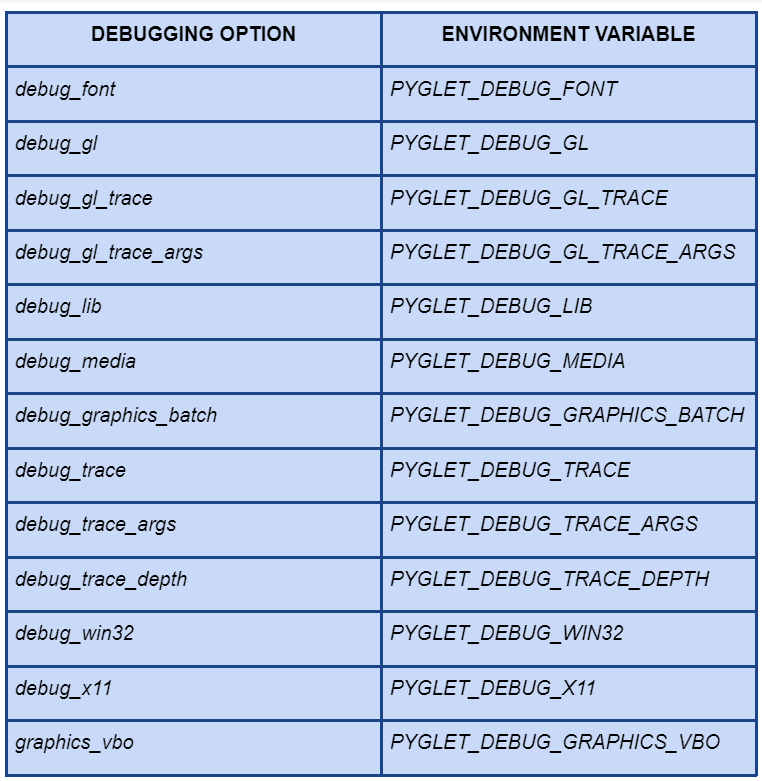
Every debugging option above is of boolean type except one, that is, debug_trace_depth, which is of integer type.
Debugging is categorized into two types, namely, Platform-specific debugging and Platform independent debugging.
Platform Specific Debugging
Some of the platform-dependent options debug the specific modules. These options are debug_media and debug_font. These functions debug the pyglet.media and pyglet.font modules, respectively. Hence, they are used by advanced developers only.
The undocumented pyglet.lib module works with the help of the debug_lib option. It ensures that the path of each loaded library is printed to standard out. Sometimes, this procedure becomes very complex. This is because Linux or Mac OS X are required to find the correct library. And on Windows, not all libraries can be loaded via this module, so, they will not be loaded.
Note that Windows still follows an easier procedure because loading Windows DLLs is sufficiently simple.
We will take into consideration two popular platforms to understand Platform Specific Debugging better.
Linux
The debug_x11 option of debug class in Pyglet catches the X11 errors and suppresses them. X11 errors are such errors that are generated by the number of X servers in the wild. These errors can be ignored safely.
debug_x11 option makes sure that these errors are dumped to standard out, also there is a traceback of the Python stack, only if reported asynchronously.
Windows
All library calls into either of the three, user32.dll, kernel32.dll and gdi32.dll are intercepted by the debug_win32 option. SetLastError(0) is called before each library call and after that GetLastError() is called. debug_win32.log is the file in which all the errors discovered are stored.
Platform Independent Debugging
Various Platform Independent Debugging options are described below.
Tracing
The two debugging options that facilitate tracing are debug_gl_trace and debug_gl_trace_args.
All called OpenGL functions are dumped to standard out by the debug_gl_trace option.
In case the arguments given to each function also need to be printed, then this option is combined with another option, namely, the debug_gl_trace_args.
Tracing Execution
The three debugging options that facilitate tracing of execution are debug_trace, debug_trace_args, and debug_trace_depth.
To enable Python-wide function tracing and to ensure that every function call is printed to standard out, the debug_trace option is used. A huge number of function calls are required to initialize Pyglet. It becomes important to manage such a large number of function calls. Thus, this function is used to redirect standard output to a file.
In case the arguments to each function call also need to be printed, debug_trace_args is used.
In accordance with the value, debug_trace_depth perform its function. If its value is equal to 1, which is the default value, no callers are printed. If its value is greater than 1, then the callers of each function are printed.
Error Checking
Most OpenGL calls are intercepted by the debug_gl debugging option. Then, g1GetError is called when such a call is legal. An exception is raised immediately if an error is reported.
Unless the -0 flag, which is the optimization flag, is given to Python, this option is enabled by default.
Debugging OpenGL
When debugging the ‘graphics’ module, the graphics_vbo debugging option is very useful. The utilization of vertex buffer objects in pyglet.graphics is enabled by the graphics_vbo option. This option also facilitates isolating code to determine if there is any fault in the video driver.
The debug_graphics_batch is used to debug applications by making use of ‘Group’ and ‘Batch’ rendering. If any ‘batch’ object wants to dump its rendering tree to standard output before any drawing or after any change, the debug_graphics_batch option is used.
Read about Batch Operating System here.


 8+ registered

