Do you think IIT Guwahati certified course can help you in your career?
Introduction
Descriptive statistics are visual representations of data that summarise and describe its characteristics meaningfully. They are essential for exploratory purposes, allowing data analysts and researchers to spot patterns and potential insights. Descriptive statistics use central tendency and variability measures to clearly understand data, allowing for patterns, outliers, and distributions. They are a perfect starting point for understanding data without complex calculations, providing valuable insights in no time.
This article will discuss descriptive statistics and types with clear information about descriptive statistics.
What Are Descriptive Statistics?
Descriptive statistics are a set of tools in data analysis that help us understand and summarize the main features of a dataset. They provide simple ways to describe essential aspects like central tendency (mean, median), variability (range, standard deviation), and distribution shape. By using descriptive statistics, we can quickly grasp the overall picture of data, spot patterns, and identify potential outliers. These techniques make complex data more manageable and accessible, aiding in making informed decisions and drawing meaningful insights from the information.
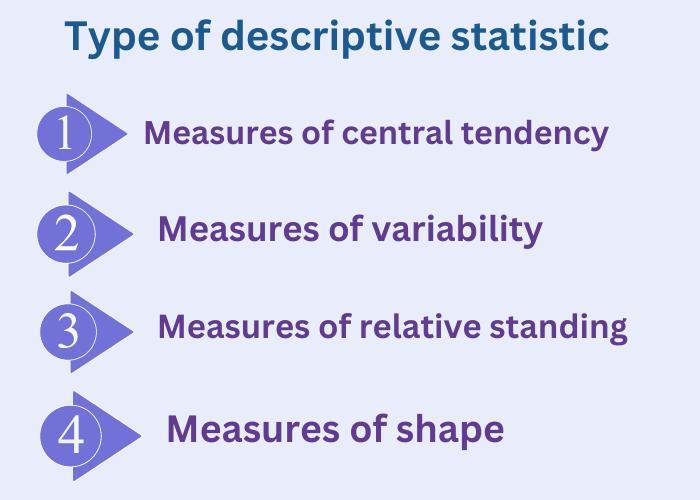
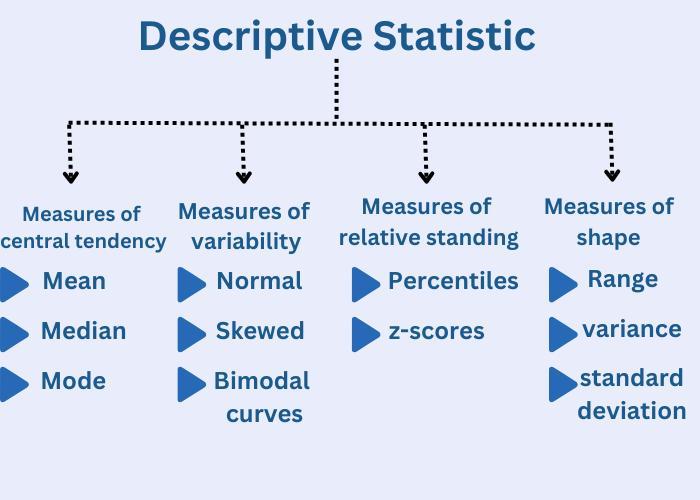
Types of Descriptive Statistics
Type of Descriptive Statistic
Definition
Examples
Measures of central tendency
Calculate a single value that is representative of an entire data set.
Mean, median, mode
Measures of shape
Describe the overall pattern or distribution of the data.
Normal, skewed, bimodal curves
Measures of relative standing
Indicate the position of a value relative to the rest of the data set.
Percentiles, z-scores
Measures of variability
Indicate how spread out or dispersed the values in a data set are.
Range, variance, standard deviation
Measures of Central Tendency
To gain insight into your data, you need to calculate measures of central tendency. These provide a summary of your data by attempting to determine a single value as representative of an entire set of scores.
Mean
The mean, or average, is the sum of all scores divided by the number of scores in a data set. It helps determine the central location and provides an overall sense of scores. To calculate the mean, add up all numbers and divide by the number of scores. However, it can be influenced by extreme scores.
Median
The median is the middle number in a data set when the numbers are listed in ascending or descending order. To find the median, list the numbers in order and pick the number in the middle. If there is an even number of scores, calculate the mean of the two middle numbers. The median is a useful measure of central tendency for data sets containing extreme scores because they do not influence it.
Mode
The mode is a significant concept in data analysis, representing the score that appears most frequently in a dataset. It's like the highest point on a hill in a frequency chart. In some instances, datasets might have more than one mode, indicating multiple common values. The mode lets us glimpse what's most prevalent among the data points. It's like identifying the most frequent color of marbles in a bag.
However, the mode doesn't necessarily pinpoint the center of the data. Data can have multiple values vying for the most common spot without being the true center. Imagine a collection of exam scores where both 75 and 80 appear most often; this doesn't tell us where most scores cluster around, making the mode less ideal for representing central tendency.
To put it simply, the mode highlights what's frequent, but it's not always the heart of the data. It's like identifying the most common ingredient in a recipe; it doesn't show the overall taste. Yet, the mode is essential in understanding data patterns, especially when we want to know what values are popular, even if they don't indicate the true middle.
Measures of shape
In descriptive statistics, Measures of shape are essential for unraveling the intricate patterns and traits embedded within data distributions. These measures guide us in comprehending whether data follows a normal (symmetrical), skewed (lopsided), or bimodal (dual-peaked) distribution.
Normal Curve
A normal distribution crafts an elegant symmetrical curve, resembling a well-proportioned bell. Within this curve, the mean, median, and mode converge at the midpoint, forging a harmonious data distribution on both sides. This alignment signifies that most data points cluster around the mean, making it a pivotal reference for analyzing data patterns and central tendencies.
Skewed Curve
A skewed curve surfaces when data leans significantly toward one end of the distribution. Positively skewed curves elongate towards the right, with the mean tugged towards the higher values, suggesting the influence of outliers. Conversely, negatively skewed curves stretch towards the left, coaxing the mean towards lower values, indicating the presence of atypical lower data points.
Bimodal Curve
A bimodal distribution exhibits the intriguing characteristic of possessing two distinct peaks, underlining the prevalence of two notable modes. This phenomenon hints at the likelihood of two separate underlying processes or distinct groups within the data.
Assessing these shapes involves delving into skewness and kurtosis. Skewness gauges the extent and orientation of skewness, while kurtosis measures the thickness of tails compared to a normal distribution. These metrics aid in discerning the symmetry, asymmetry, or peculiar peaks within data distributions.
Comprehending the shape of data distributions is pivotal for making judicious interpretations and decisions rooted in data analysis. This understanding bestows insights into the behavior and traits of datasets, serving as a compass for drawing meaningful conclusions from the diverse data landscape.
Measures of relative standing
In descriptive statistics, measures of relative standing help us understand where a particular data point stands compared to other data points in a dataset. Two common measures in this regard are percentiles and z-scores.
Percentiles
Ittells us what percentage of data points are below a given value. For instance, the 75th percentile means 75% of data points are below that value. They help understand how a data point compares to the rest regarding its position. If someone's test score is at the 90th percentile, it means they scored better than 90% of the people.
Z-scores
It helps us understand how far a data point is from the mean in terms of standard deviations. A positive z-score indicates the data point is above the mean, while a negative one means below. A z-score of 0 means it's precisely at the mean. Z-scores help in comparing data from different distributions and understanding outliers.
Both these measures assist in making data more understandable and comparable. They provide insights into whether a value is typical or exceptional in a dataset, allowing us to accurately interpret the data's relative position. Whether finding the highest scores or identifying unusual observations, percentiles and z-scores are valuable tools in descriptive statistics to gauge data about the overall dataset.
Measures of Variability
Descriptive statistics aim to summarize and describe the features of a data set in a meaningful way. Some important measures of variability provide insight into the spread and dispersion of values in the data.
Range
The range is the simplest measure of variability and is calculated as the maximum value minus the minimum value. It provides an absolute measure of the spread of values but is sensitive to outliers. For example, if most data points cluster around the mean but a few extreme values exist, the range will be large but not accurately reflect the variability for most of the data.
Interquartile range
The interquartile range (IQR) is a measure of variability that is robust to outliers, computed as the difference between the third and first quartiles. It captures the spread of the middle 50% of the values, and a higher IQR indicates more variability in the central portion of the distribution.
Standard deviation
The standard deviation measures variability by calculating the average distance between values and the mean. Low deviation indicates closeness to the mean, and high deviation indicates spread over wider range. Visual representations like histograms, box plots, and scatterplots help understand data diversity, spread, and dispersion.
Variance
Variance is a measure of variability that quantifies how much individual data points deviate from the mean. It calculates the average of squared differences between each data point and the mean, providing insight into the overall dispersion of the dataset. A higher variance suggests that data points are spread out from the mean more widely, indicating greater variability. Conversely, a lower variance indicates that data points are closer to the mean, signifying less variability. In essence, variance helps understand the extent to which data points diverge from the average, giving a clearer picture of the data's distribution and dispersion.
Descriptive Statistics in Action
Descriptive statistics are used to summarize and describe the characteristics of a data set in a meaningful way. They provide simple summaries about the measures of central tendency, variability and shape of the data.
Measures of Central Tendency
The mean, median, and mode are measures of central tendency. The mean is the average of the data set calculated by summing all the values and dividing by the number of values. The median is the middle value in the data set. The mode is the value that occurs most frequently. These provide an overview of where the center of the data lies.
Measures of Variability
Variability measures the dispersion of data, while range represents the difference between the highest and lowest values. Variance and standard deviation indicate deviation from the mean. Small standard deviations indicate closeness to the mean, while large deviations indicate spread over a wider range.
Shape of the Distribution
The shape of the distribution refers to the pattern of how the values are distributed. A normal (bell curve) distribution has most values clustered around the mean, with symmetrical tails on either side. A skewed distribution has most values concentrated on one side of the mean. The degree of skewness indicates the lack of symmetry in the distribution. Kurtosis measures the peakedness of the distribution, indicating a flat, normal, or pointy shape.
What’s the Difference Between Descriptive Statistics and Inferential Statistics?
Here's a tabular comparison of descriptive statistics and inferential statistics:
Aspect
Descriptive Statistics
Inferential Statistics
Purpose
Summarize and describe data to understand its characteristics.
Make inferences and draw conclusions about populations or data from a sample.
Data Used
Analyzes and summarizes the data you have on hand.
Uses data from a sample to make predictions or draw conclusions about a larger population.
Scope
Provides information about the data itself and doesn't make broader claims.
Generalizes from a sample to make statements or predictions about a population.
Examples
Mean, median, mode, range, standard deviation, histograms, etc.
Confidence intervals, hypothesis testing, regression analysis, analysis of variance (ANOVA), etc.
Goal
Describe and present data in a clear and understandable manner.
Make inferences, test hypotheses, and support decision-making.
Population vs. Sample
Focuses on the data in the sample itself.
Uses data from a sample to make inferences about a larger population.
Tools
Descriptive statistics tools include measures of central tendency, dispersion, and data visualization.
Inferential statistics tools include hypothesis tests, confidence intervals, regression analysis, and more.
Assumptions
Doesn't require assumptions about the population.
Often relies on assumptions about the population or sampling process.
Examples of Use
Summarizing the test scores of a class, reporting demographic data, creating histograms of survey responses.
Testing if a new drug is more effective than an existing one based on a sample of patients, estimating the average income of a city from a sample survey.
Frequently Asked Questions
What is meant by descriptive statistics?
Descriptive statistics summarize and present data, describing its characteristics. Inferential statistics use data from a sample to make predictions or draw conclusions about a larger population, often based on assumptions and statistical tests.
What is the difference between descriptive and inferential statistics?
Descriptive statistics summarize data to understand its properties, while inferential statistics use data from a sample to make predictions about a larger population, relying on assumptions and statistical tests to draw conclusions.
What is the importance of descriptive statistics?
Descriptive statistics help simplify complex data, providing an initial understanding of its key features. They are crucial for data summarization, visualization, and communication, aiding decision-making, pattern recognition, and hypothesis generation in research and analysis.
Conclusion
This article explains the descriptive statics along with types in a full-fledged manner. We hope this blog has helped you enhance your knowledge of descriptive statistics. If you want to learn more, then check out our articles.


 8+ registered

