Do you think IIT Guwahati certified course can help you in your career?
Introduction
Hey Readers!!
When it comes to understanding complex datasets, data visualization plays a crucial role. Tableau has two main methods for visually representing data known as Discrete Fields and Continuous Fields. These concepts are quite interesting. So let us understand how they differ and how they can help us understand hidden patterns and trends.
This article will help you answer all the questions above and deeply understand discrete fields vs continuous fields in Tableau.
Tableau
Tableau is a powerful tool for data visualization that allows users to analyze and present data in an interesting and dynamic way. You may connect to different data sources, including spreadsheets or databases. Also, turn raw data into smart visualizations like charts, graphs, and dashboards. Technically speaking, Tableau creates visualizations using a drag-and-drop interface.
Alright!! Now let us look at discrete and continuous fields in Tableau.
Brief about Discrete Fields and Continuous Fields
Tableau has two types of fields: Discrete Fields and Continuous Fields. Let's understand what each of these means briefly.
Discrete Fields: In Tableau, discrete fields represent categorical data. This means they deal with different, distinct values that cannot be separated further. Names, regions, and categories are examples of discrete fields. Discrete fields are used when you want to group and compare data based on different categories. They help you to organize and add data into discrete groups, allowing you to compare and analyze different categories more easily.
Continuous Fields: In Tableau, continuous fields represent numerical or quantitative data. These fields deal with information that can have a variety of values. Continuous fields are used when precise measurement and analysis of data are required. They are commonly used to create continuous axes and execute mathematical operations such as adding, averaging, and summation.
Now let us look at the green color fields and blue color fields.
Green Color Fields and Blue Color Fields
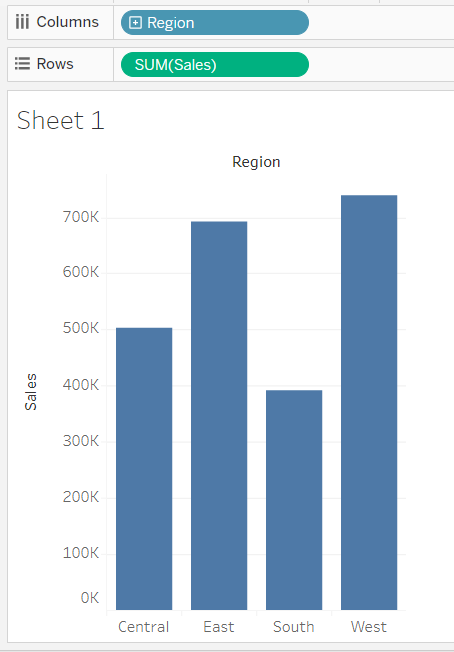
Blue Colour Fields are discrete Tableau fields that hold categories or separate values, like different categories or groups. For example, if we have a dataset containing a column representing various fruits, such as apples, oranges, and bananas. We can consider this column a Blue Colour Field in Tableau.
The Region field in this example is set to Discrete. Instead of an axis, horizontal headers are produced. The horizontal headers and blue background make it easier to see that it's discrete.
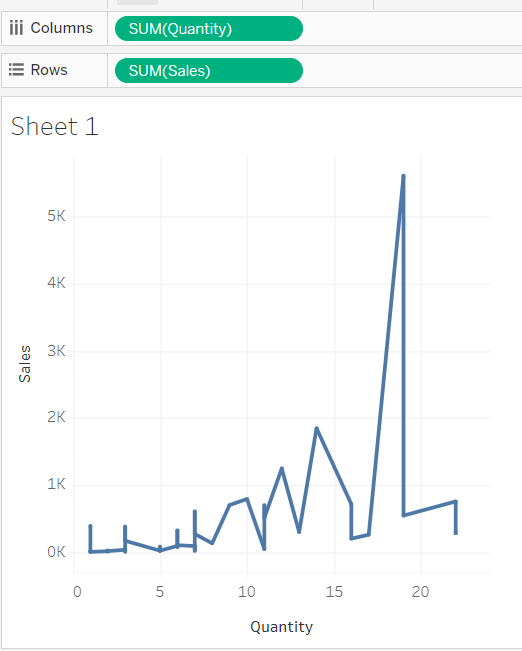
In Tableau, Green Color Fields are the continuous fields. Continuous fields are fields such as temperature, time, and sales revenue. These often reflect numerical or quantitative data that can be monitored on a continuous scale. This enables the visualization of data's progressive changes and patterns. It allows us to have deeper insights and analysis of data.
In this example, the Quantity field is set to Continuous. Then a horizontal axis appears at the bottom of the on view. You can see that it's a continuous field because of the green background and axis.
Alright!! Now let us dive into the features of discrete fields and continuous fields.
Features of Discrete Fields
Here are some features of Discrete fields:
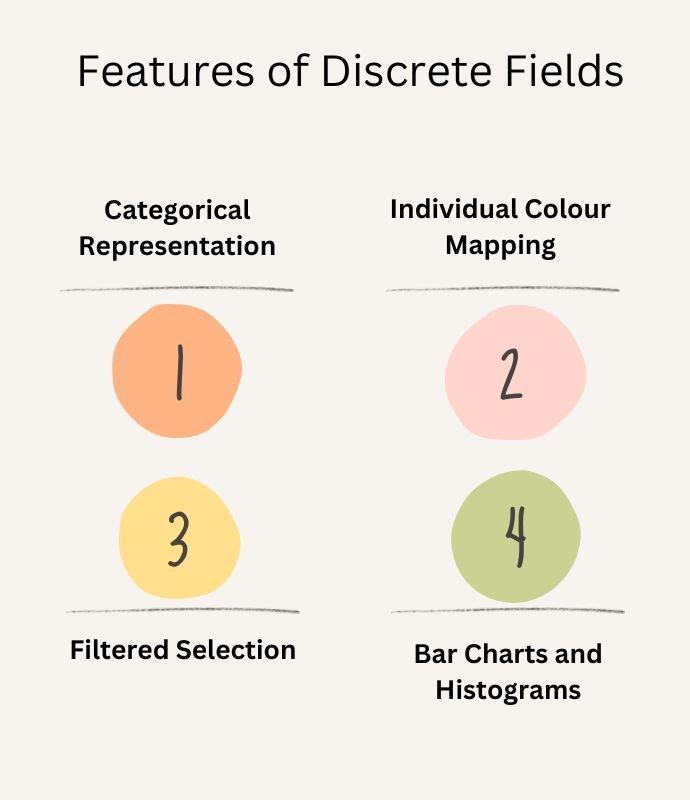
Categorical Representation: In Tableau, discrete fields are used to represent categorical or separate data. They are useful for variables that may be grouped, such as product categories, geographies, or customer segments.
Individual Colour Mapping: Each value within a discrete field is assigned its own color. Which provides a clear visual distinction between categories. This helps in identifying and analyzing specific groups within the data.
Filtered Selection: Discrete fields allow users to filter and select certain groups of data for the targeted study. Users can change the displayed information by selecting or deselecting individual values. Which narrows their investigation to relevant subgroups.
Bar Charts and Histograms: Discrete fields are often used in the creation of bar charts and histograms. Where each category is represented by a single bar. This visualization approach helps in successfully comparing different groups.
Features of Continuous Fields
Here are some features of Continuous fields:
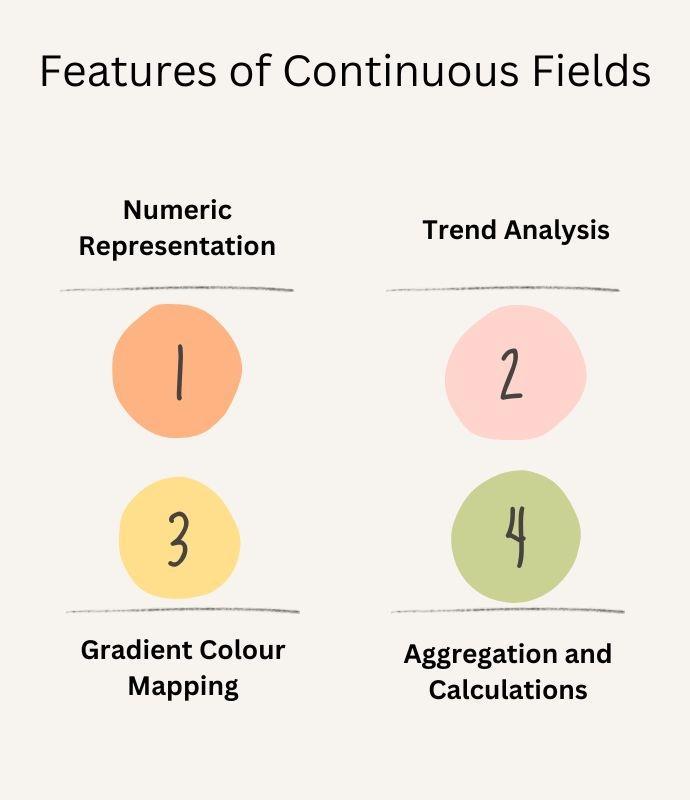
Numeric Representation: Continuous fields in Tableau are used to display numerical or quantitative data on a continuous scale. Temperature, time, sales income, and stock prices are all examples.
Trend Analysis: Continuous fields are ideal for analyzing data trends, patterns, and correlations. Users can see the progression of values over time or across a continuous range by visualizing the data with line charts, area charts, or heat maps.
Gradient Colour Mapping: To express the range of values, continuous fields employ a gradient color scale with varying shades of a single color or a color spectrum. This enables the visualization of data's progressive changes and trends.
Aggregation and Calculations: Continuous fields simplify aggregation functions such as sum, average, and maximum for numerical data analysis. Users can create calculated fields to execute mathematical operations or new metrics based on continuous data.
Comparison Table with Examples
Let us look at Tableau's comparison table of discrete fields and continuous fields.
Discrete Fields
Continuous Fields
The discrete field represents discrete or classified data.
The continuous field represents numerical or quantitative data.
In discrete fields, individual colors are used for each category to help in visual differentiation.
To represent the range of values, a gradient color scale is used.
Filtering and selection of certain categories for targeted analysis are possible.
Allows for trend analysis as well as pattern and correlation discovery.
In Discrete Fields, bar charts and histograms are often used for effective comparison.
Continuous fields are suitable for trend analysis using line charts, area charts, and heat maps.
Categorical aggregation and computations are supported.
Calculated fields and mathematical processes are made easier for numerical analysis.
For example, the number of threads in a sheet, customer name or row ID, or State
For example, unit price, time, and profit or order quantity.
Frequently Asked Questions
How to choose when to convert between discrete and continuous Tableau?
Choose discrete fields in Tableau for distinct categories and comparisons. Use continuous fields for numerical trends and calculations. Consider the parameters like data type, analysis needs, visualization design, and data granularity to make a conversion decision.
Can discrete data be converted into continuous data?
No, discrete data cannot be directly converted into continuous data in Tableau. Discrete data represent distinct categories or labels, while continuous data represent numerical values. Both are fundamentally different, and conversion between them is not possible within the Tableau framework.
Can a variable be both discrete and continuous?
No, a variable cannot be both discrete and continuous in Tableau. Discrete variables represent distinct categories, while continuous variables represent numerical values. They are mutually exclusive data types with different characteristics and cannot overlap.
Conclusion
In this article, you have learned about Discrete Fields vs Continuous Fields in Table. Features of discrete and continuous fields and the comparison between discrete and continuous fields. We hope this article briefly helped you know the Discrete and Continuous fields.
If you want to learn more, refer to these articles:


 8+ registered

