Do you think IIT Guwahati certified course can help you in your career?
Introduction
A compiler first converts the source code of any programming language into an intermediate code (See Intermediate Code Generation). It is then converted into basic blocks. After dividing an intermediate code into basic blocks, the flow of control among basic blocks is represented by a flow graph.
A control flow graph shows how program control is parsed among the blocks.
The control flow graph depicts all of the paths that can be traversed during the execution of a program.
It can be used in software optimization to find unwanted loops.
Representation of Flow Graphs
Flow graphs are directed graphs. The nodes/bocks of the control flow graph are the basic blocks of the program. There are two designated blocks in Control Flow Graph:
Entry Block: The entry block allows the control to enter in the control flow graph.
Exit Block: Control flow leaves through the exit block.
An edge can flow from one block A to another block B if:
the first instruction of the B's block immediately follows the last instruction of the A's block.
there is a conditional/unconditional jump from A's end to the starting of B.
B follows X in the original order of the three-address code, and A does not end in an unconditional jump.
Let's see an example,
Consider the source code for converting a 10 x 10 matrix to an identity matrix.
for r from 1 to 10 do
      for c from 1 to 10 do
             a [ r, c ] = 0.0;

for r from 1 to 10 do
         a [ r, c ] = 1.0;
The following are the three address codes for the above source code:
1) r = 1
 2) c = 1
 3) t1 = 10 * r
 4) t2 = t1 + c
 5) t3 = 8 * t2
 6) t4 = t3 - 88
 7) a[t4] = 0.0
 8) c = c + 1
 9) if c <= 10 goto (3)
 10) r = r + 1
 11) if r <= 10 goto (2)
 12) r = 1
 13) t5 = c - 1
 14) t6 = 88 * t5
 15) a[t6] = 1.0
 16) r = r + 1
 17) if r <= 10 goto (13)
There are six basic blocks for the above-given code, which are:
B1 for statement 1
B2 for statement 2
B3 for statements 3-9
B4 for statements 10-11
B5 for statement 12
B6 for statements 13-17.
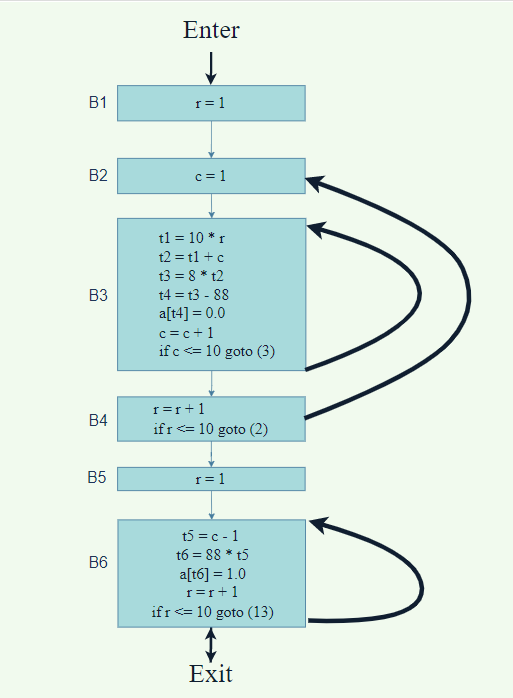
The control flow graph of the above-given basic blocks is:
Explanation:
B1 is the start point for the control flow graph because B1 contains the starting instructions.
Because B1 does not end with unconditional jumps, and the B2 block's leader immediately follows B1's leader, B2 is the only successor of B1.
There are two successors to the B3 block. The conditional jump in the last instruction of block B3 is targeted at the first instruction of the B3 block; therefore, one is block B3 itself. Another is block B4 due to conditional jump at the end of the B3 block.
The last block, B6, is the exit point of the control flow graph.
A flow graph is a directed graph containing control flow information for the set of fundamental blocks. A control flow graph shows how program control is parsed among the blocks.
What is the use of a flow graph?
Flow charts are basic diagrams that outline a process so that it can be easily communicated to others. They can also be used to define and analyze a process, creating a step-by-step image of it.
How flow graph is helpful for code optimization?
A control flow graph displays how program control is parsed between blocks. It is a valuable tool that can help software optimization by finding unwanted loops.
Conclusion
In this article, we learned about Flow Graphs. We learned that flow graphs are directed graphs that contain control flow information for the set of fundamental blocks. A control flow graph shows how program control is parsed among the blocks. It can be used in software optimization to find unwanted loops.
We then learned the properties and representation of Control Flow Graphs.
Control flow graphs represent basic blocks in a software program. Click here to learn more about basic blocks.


 9+ registered

