Do you think IIT Guwahati certified course can help you in your career?
Introduction
Google announced Flutter, a free and open-source mobile user interface framework, in May 2017. In a nutshell, it enables you to develop a native app for mobile using only one codebase. You can design two different apps using the same programming language and codebase (for iOS and Android).
So, in this article, we are going to look upon the Flutter Charts in detail:
Flutter Charts
A chart is a graphical representation of data in which it is represented by a symbol such as a line, bar, pie, or another similar object. The chart behaves like a typical chart in Flutter. In Flutter, we use a chart to convey the data in a graphical format that the viewer can grasp quickly.
Don’t worry Ninja, we are here to help you.
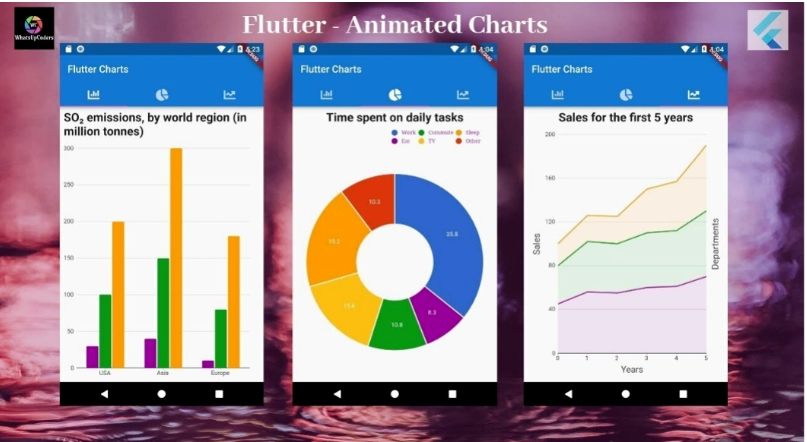
Charts Supported In Flutter
Flutter Charts supports three different chart kinds, each with its own set of setting options:
Bar Charts- Support for stacking several data series, displaying target lines, and presenting the bars horizontally are all included in bar charts.
Line Charts- Time series support is included in line charts.
Pie or Donut Charts- It's a graph that shows information in a circular arrangement.
Bar Charts
It is a graph that uses rectangular bars to represent categorical data. It might be vertical or horizontal.
Implemented as follows:
bar_chart(
  bar_chart_data(
    // write your code here or logic also
  ),
);
Line Charts
A line chart is a graph that connects individual data points with lines. It presents the data as a series of data points. It is mainly used to track changes, both short and long.
Implemented as follows:
Line_chart(
Line_chart_data(
    // write your code or logic here.
  ),
);
Pie or Donut Charts
It's a graph that shows information in a circular arrangement. The circle in this graph is broken into sectors that display percentage or proportional data.
Implemented as follows:
Pie_chart(
  Pie_chart_data(
    // write your code or logic here.
  ),
);
After adding the dependency, go to the upper left corner of the screen and click the Get Packages option. Now open the main.Dart file and replace the following code with it.
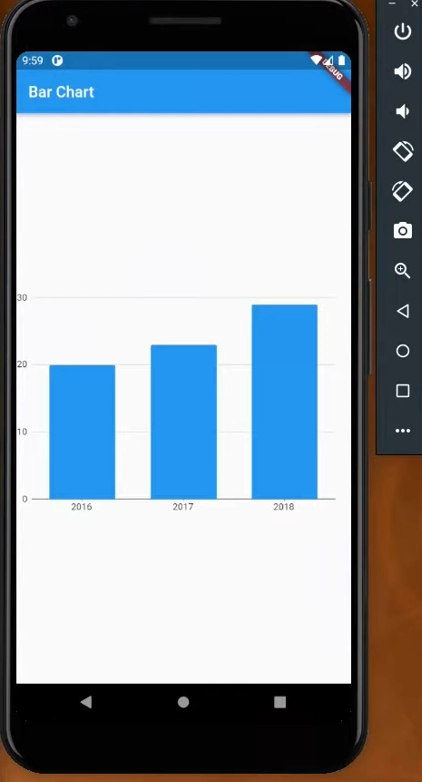
Time for an Example: Bar Charts
Create a new Flutter project using the IDE. Then open the project, go to the lib folder, and double-click the pubspec.YAML file. The chart dependency must be added to this file.
Flutter has multiple chart dependencies, and we'll utilize the fl chart dependency here. As a result, add it as follows:
The Flutter Charts package is a Dart-based data visualization framework for producing beautiful, animated, and high-performance charts that are used to create high-quality mobile app user interfaces.
Why is a flutter chart used ?
In Flutter, we use a chart to convey the data in a graphical format that the viewer can grasp quickly. We can also draw a graph to show how our values have changed.
The chart can readily interpret the data and provide monthly or yearly performance information whenever we need it.
Benefits of flutter charts ?
Charts are supplied to make data easier to interpret since they make it simple to read the data and determine performance yearly. The real benefit of flutter charts is that they can be utilized to grasp vast amounts of data through graphical representation quickly.
Why is flutter so popular ?
The majority of businesses are now enthused about Flutter. It's because a single codebase can be used to create apps for Android, iOS, Windows, Mac, Linux, and the web. Despite its rapid development and versatile user interface, many developers prefer React Native..
What is Flutter SDK ?
Flutter is a free and open-source UI development kit. This toolkit provides its rendering engine, a comprehensive set of ready-made widgets, unit and integration testing APIs, plugin APIs, command-line tools for developing and compiling apps, and a react-style framework.
Conclusion
In this article we discussed the Flutter Chart. We had also seen various types of Flutter Charts and their implementation. And in the last we had seen a bar chart example with it’s implementation and its output.
We hope that our blog has helped you enhance your knowledge regarding Flutter Charts. Please check out these articles to improve your understanding of Flutter: Flutter Table, Flutter Tabbar, Flutter RichText.


 9+ registered

