Inserting Gantt chart in Microsoft Excel
Let us create the Gantt chart for the following data.
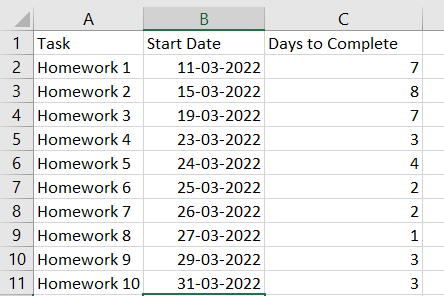
Data for which Gantt chart is to be created
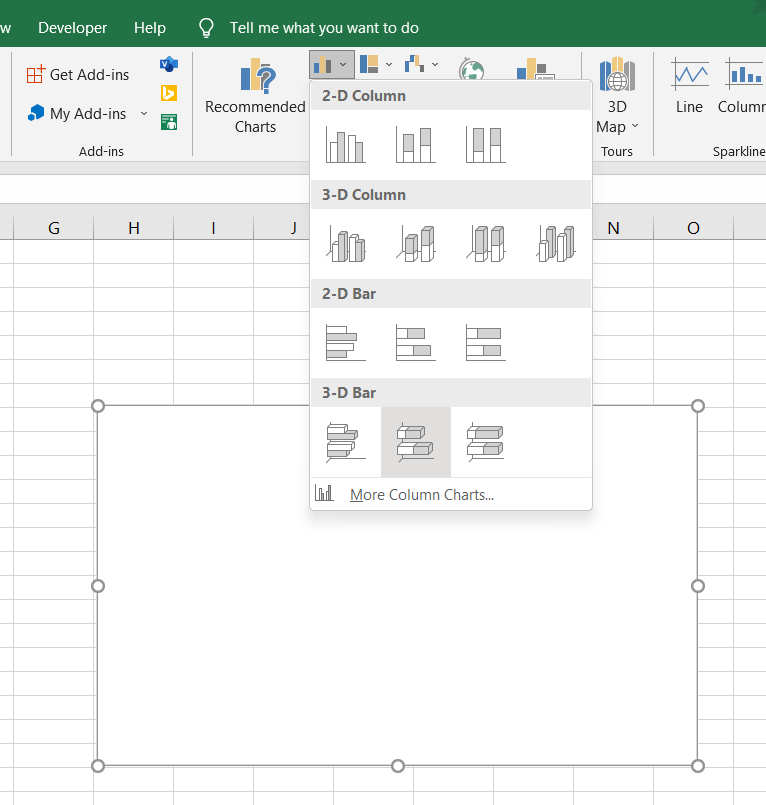
1. Click on insert=> Insert Column or Bar Chart Option.
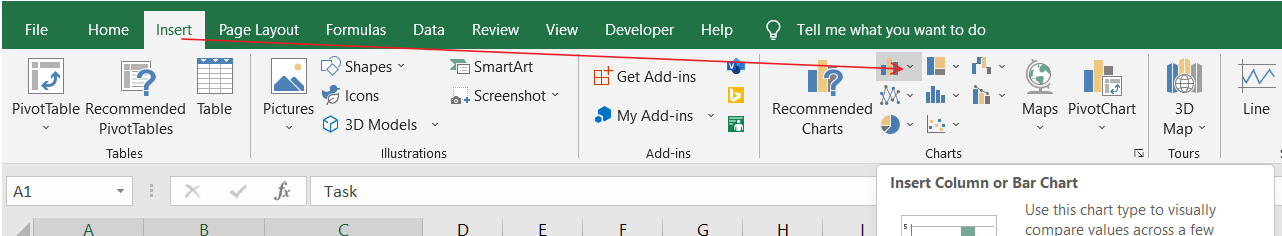
Insert Column or Bar Chart Option
If you can’t find the Bar chart, you can go to all charts by clicking on the small arrow in the right bottom corner, as shown below.
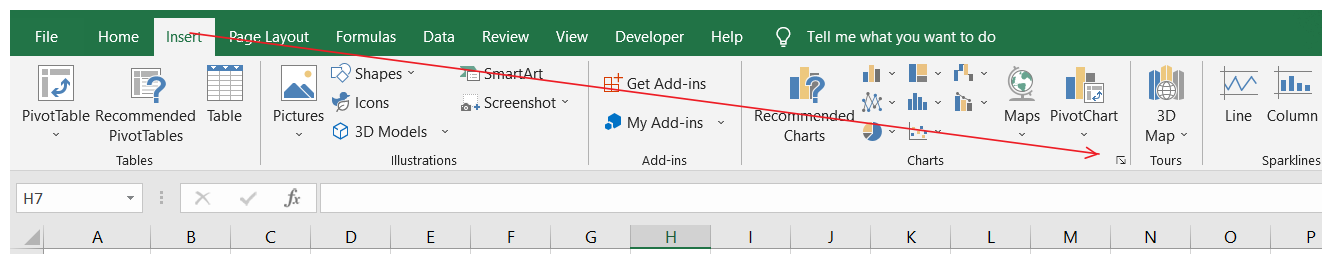
All Charts arrow
Then click on the All Charts tab.
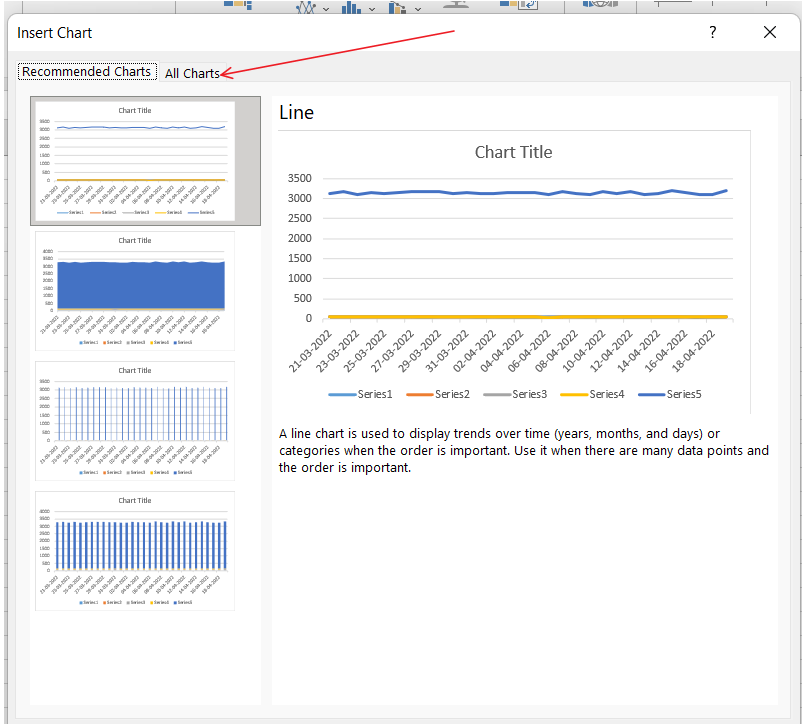
All Charts Option
Here you will find a bar chart option.
2. Select 3D Stacked bar chart. When you hover on Stacked Bar Chart, you can also see the preview.
3D Stacked Bar Chart in Excel
3. Right-click on the chart and then click on Select Data as shown below.
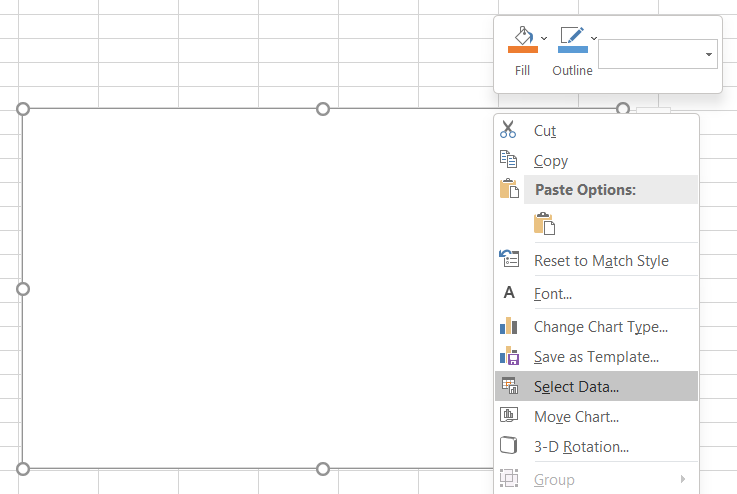
Select Data
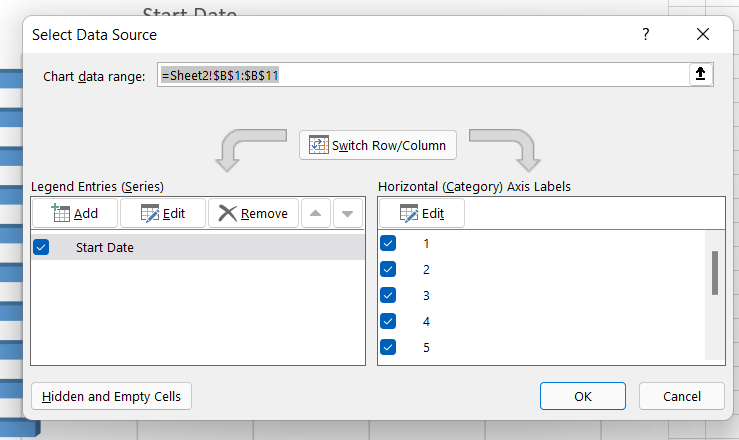
Now click on Add.
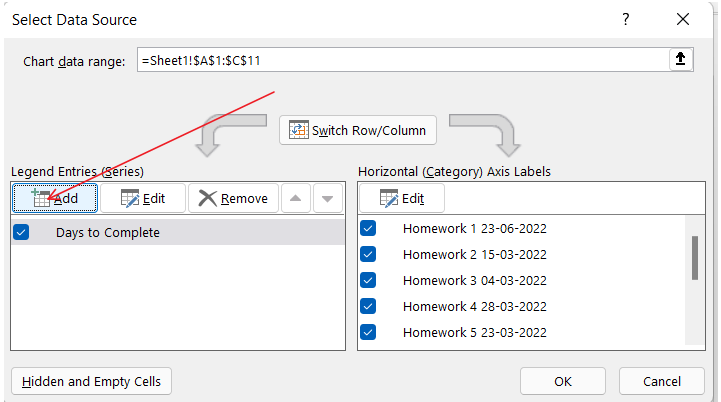
A box appears, as seen in the below screenshot.
Select the cell B1 in the Series name and the Dates in the Start Date as shown in the below screenshot.
Now again, click on the Add.
7. In the Series name, select C1, and in series in values, select C2:C11
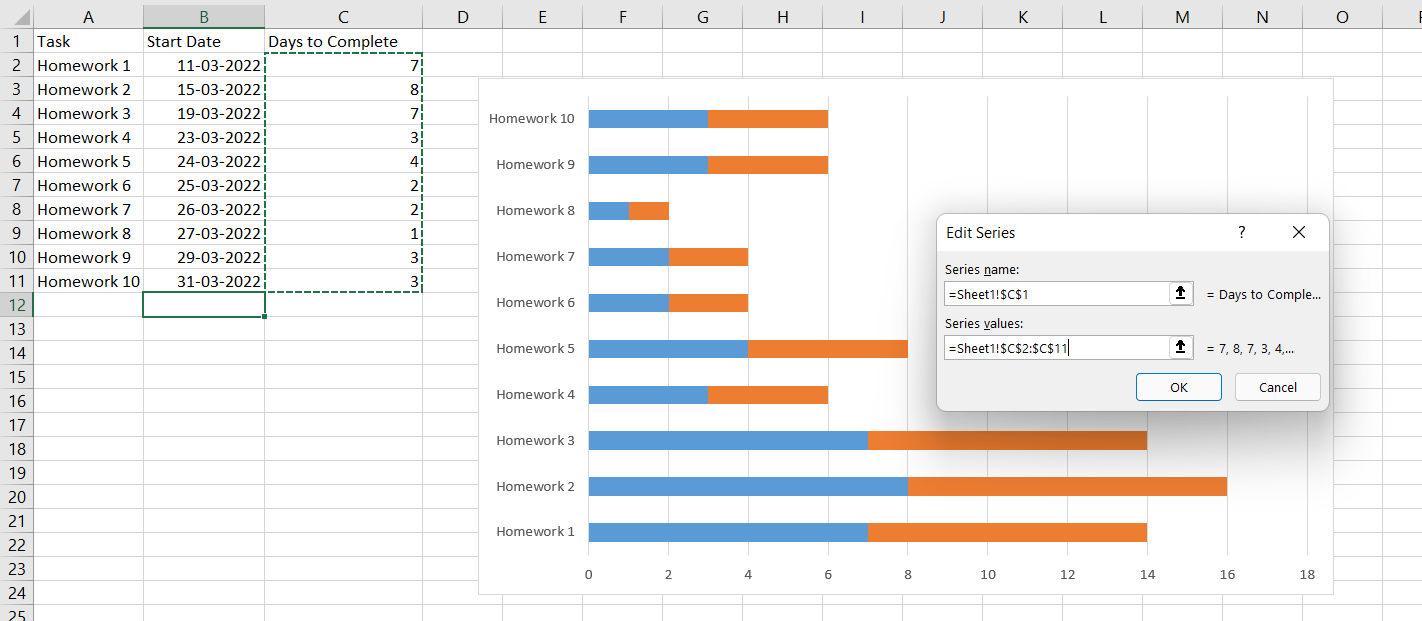
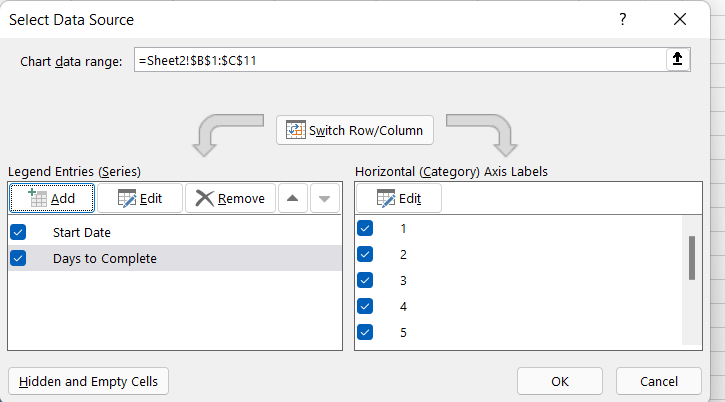
Click on OK.
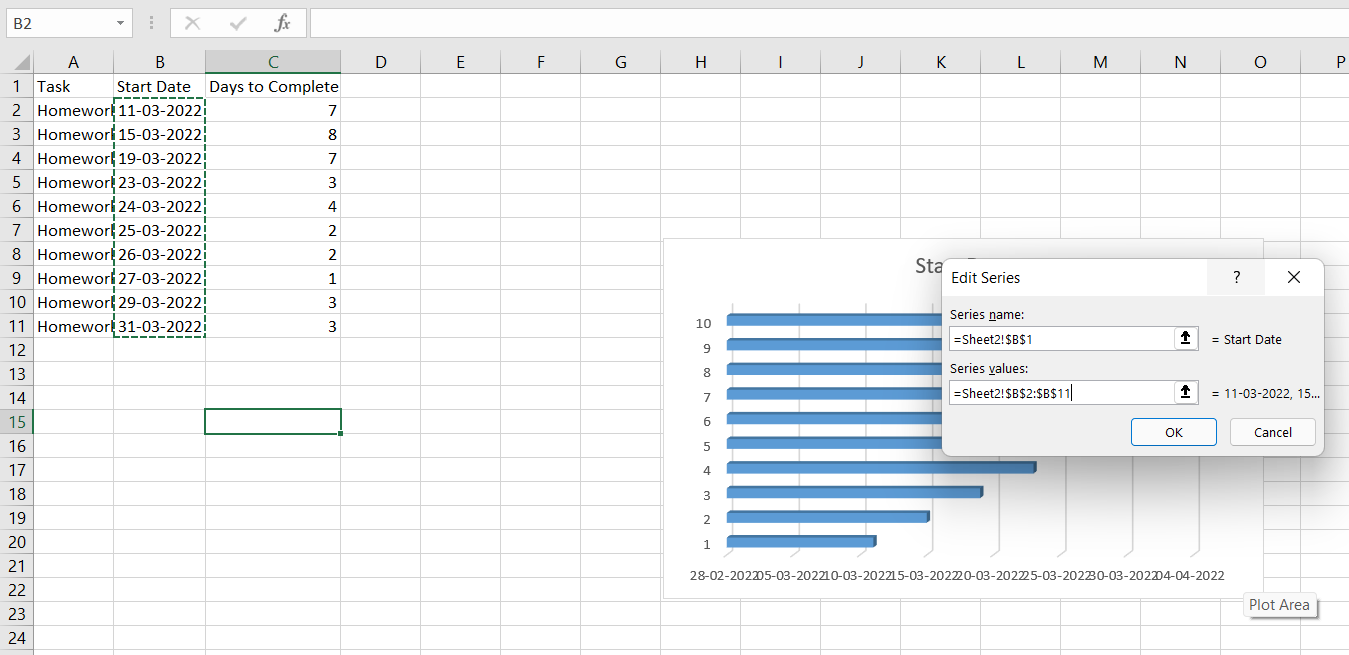
After that, click on Edit and Select A2:A11 cells.
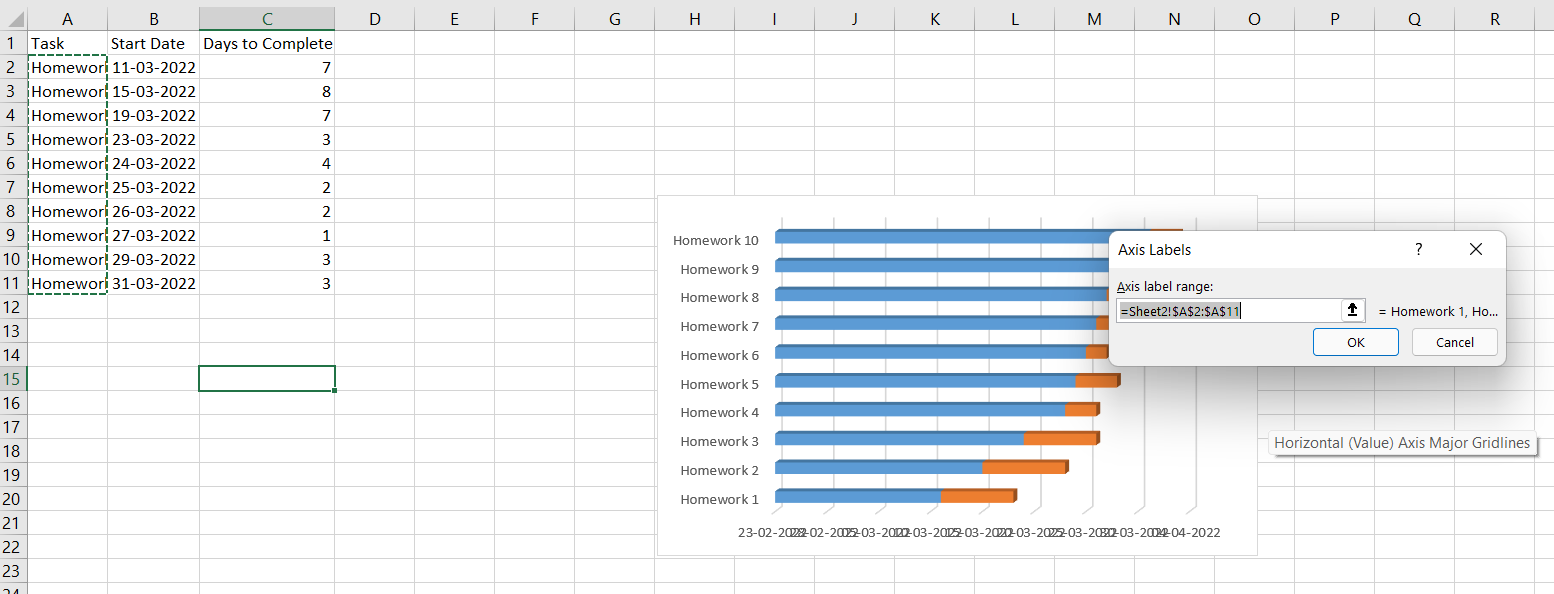
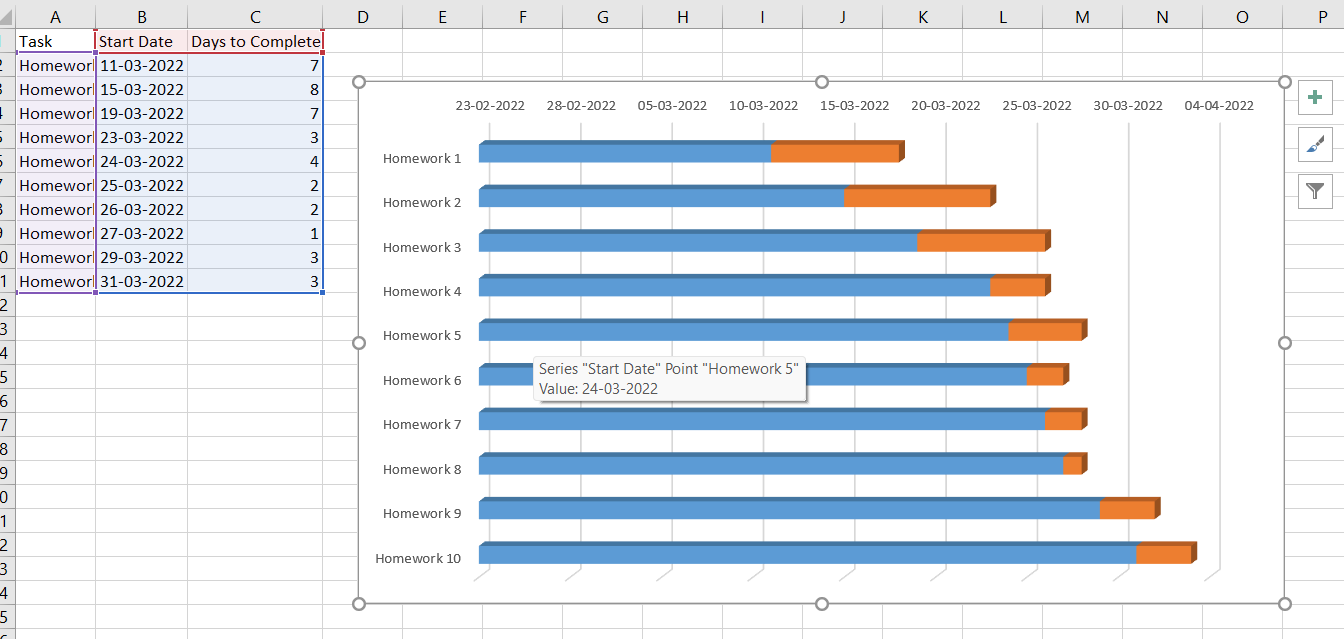
We can see a few problems, like the tasks being in reverse order.
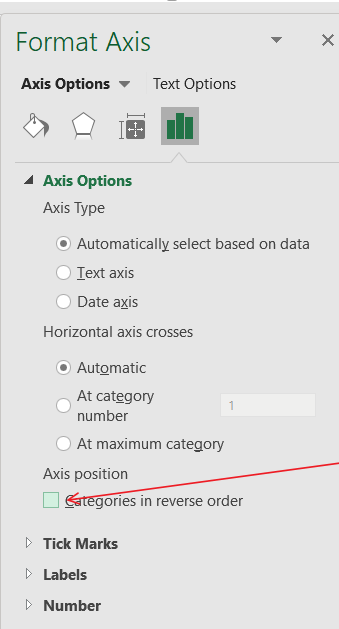
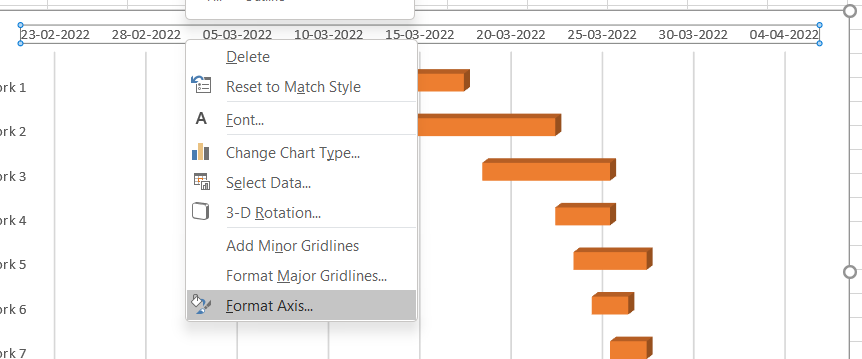
To fix that, right-click on the horizontal axis and click on Format Axis.
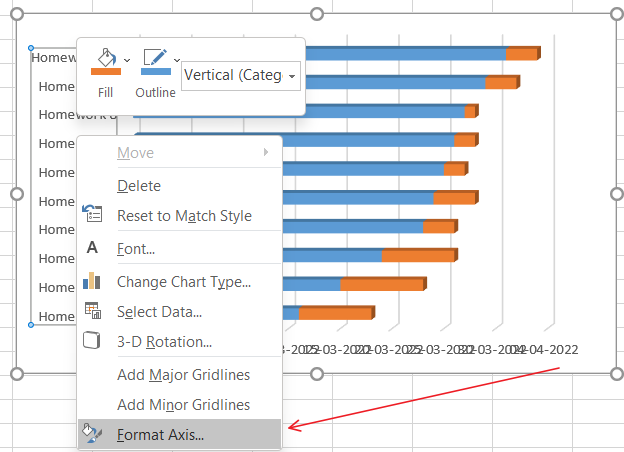
Check Categories in Reverse Order.
Category in reverse order
Right-click on the blue bar and click on format data series.
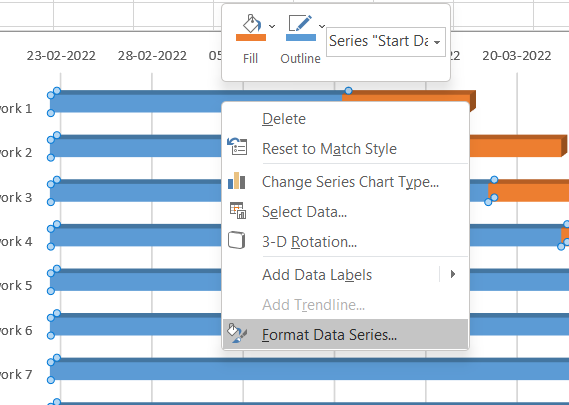
Formatting data series
Go to fill and click on No fill.
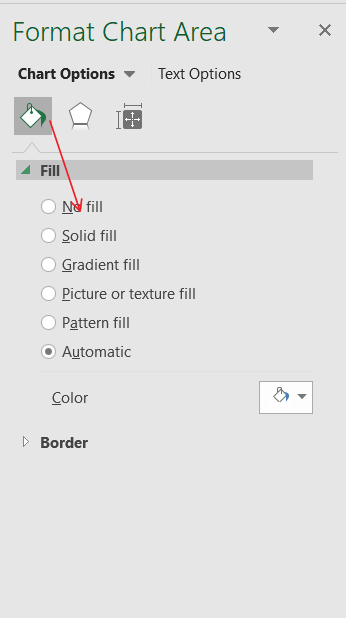
Selecting No fill
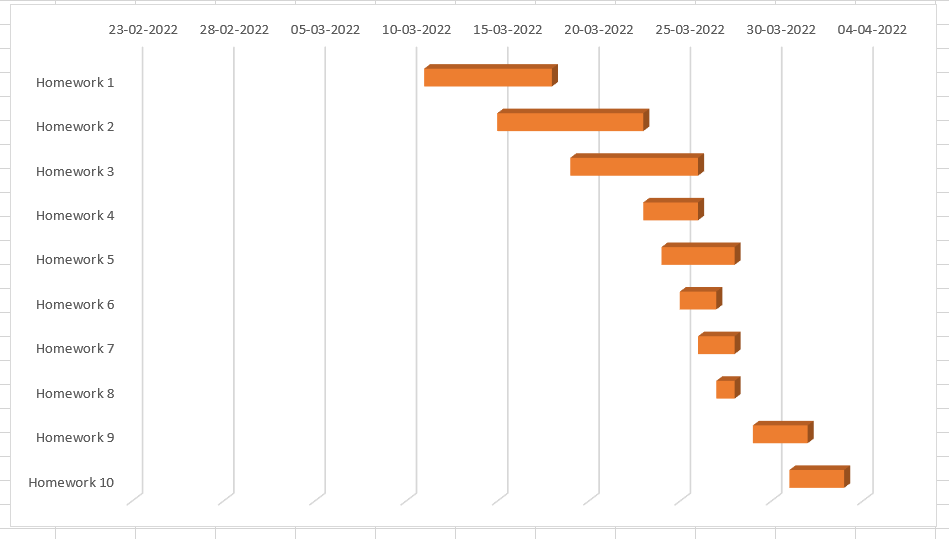
Chart after no fill
Now there is just one more problem
The Date should start from 11-03-2022.
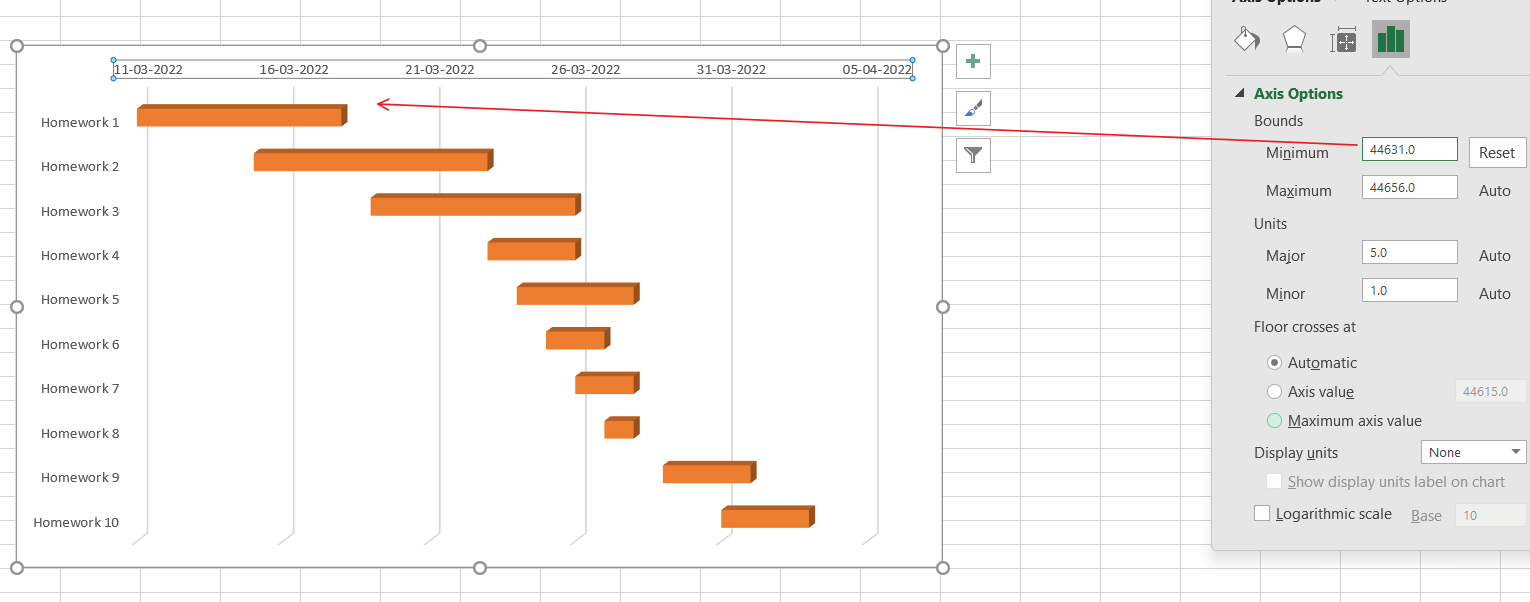
To do this, let us first find the value of the Dates.
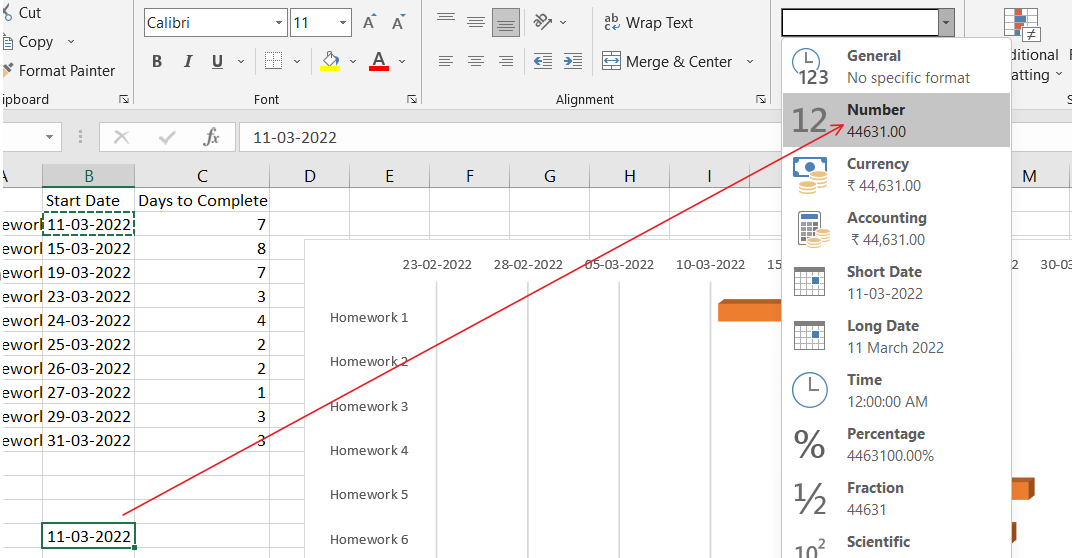
We can see in the figure that Microsoft Excel Represents the Date in the form of a Number.
Here 11-03-2022 is represented as 44631.00
Click on Dates and then click on Format Axis.
Now Set the Minimum value of the Bounds to 44631.00( the equivalent of 11-03-2022).
Then, the start date will become 11-03-2022.
Now the date starts from 11-03-2022
Finally, our Gantt Chart is ready as shown below.
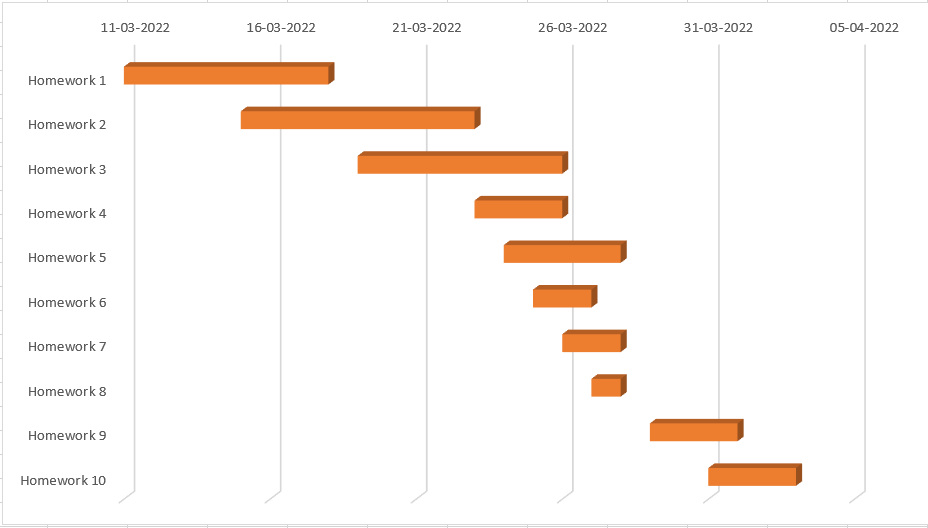
Gantt Chart
FAQs
1. What are Charts in Excel?
We need to plot graphs and charts for a better understanding and visualisation. We need Charts for understanding the fluctuations in the data.
2. What are Gantt Charts in Excel?
A Gantt chart represents the tasks in horizontal cascading bars with the start date, end date and various other activities.
3. Does Microsoft Excel have built-in Gantt Charts?
No, Microsoft does not have built-in Gantt charts.
4. How do we create Gantt Charts in Excel?
We create Gantt charts by formatting the bar charts available in Microsoft Excel.
5. What are the advantages of the Gantt Chart?
Gantt Charts gives us a visual representation of how long a project needs to be completed, how long it will take to complete a process etc.
Key Takeaways
We have extensively discussed the Microsoft Gantt Charts. We learnt how to insert Gantt Charts and how to format them.
We hope that this blog has helped you enhance your knowledge regarding the Gantt Chart, and if you would like to learn more about the various useful functions of Excel, check out our articles:
Refer to our guided paths on Coding Ninjas Studio to learn more about DSA, Competitive Programming, JavaScript, System Design, etc.
Enrol in our courses and refer to the mock test and problems available.
Take a look at the interview experiences and interview bundle for placement preparations.
Do upvote our blog to help other ninjas grow.
Happy Learning!!!


 18+ registered

