Do you think IIT Guwahati certified course can help you in your career?
Introduction
Groups and sets in Tableau are two ways to create preset subsets of data. While they appear to be identical on the surface, there are some important differences. When you establish a Group, you are essentially creating a new dimension. Groups are static. Sets are more advanced and can be dynamic. Creating a set in Tableau is the process of putting several values into a single set based on a criterion or by manually selecting them.
Tableau groups appear to be self-explanatory, while sets appear to be a little more difficult. In this article, you will learn about groups and sets in Tableau, along with their uses and creation.
What are Groups in Tableau?
Tableau Groups are collections of numerous members in a single dimension that are joined to generate a higher-level category. Tableau allows you to combine single-dimensional members together and it will automatically add a new dimension with the Tableau combine at the end of the name. Tableau makes no changes to the original dimensions of the members.
Grouping in Tableau is the process of combining numerous members from a single dimension into a higher category, whereas creating a set is the process of combining members from several dimensions and/or conditions into a dynamic or constant Group. Tableau Groups are processed using standard dimensions filters. End users can utilize Tableau Groups to filter in the same way as they would dimensions.
Typically, groups are formed based on a shared attribute or set of requirements inside a dimension. If your "Product" dimension, for instance, has several subcategories like "Electronics," "Clothing," and "Home Appliances," you can make a group named "Technology" that contains the "Electronics" subcategory. Instead of viewing and analyzing data for specific subcategories, you may now view and analyze data for the "Technology" group as a whole.
What are Sets in Tableau?
Tableau Sets are custom fields that are used to store a subset of data based on a condition. In real-time, you may create a Tableau Set by selecting members from a list or a visualization. The same thing can be accomplished by defining custom Conditions or selecting a few records from the top or bottom of a Measure. Tableau Sets can also be used to create data subsets based on user-defined criteria. A Tableau Set may, for example, be constructed to contain a subset of data from the top ten clients with the highest sales. Tableau Sets provide you direct control over components of your analysis by engaging with visualizations or dashboards.
They provide flexibility in determining set membership because they can be defined using dimensions, measurements, or calculated formulas. Sets are helpful for performing advanced filtering, emphasizing data points, forming unique groups, and contrasting various subsets of data. Tableau also offers set actions that let users alter set membership in real time based on user interactions.
Features of Groups and Sets in Tableau
Some of the features of groups are discussed below:
Groups enable you to aggregate data at a higher level by grouping numerous members or categories within a dimension into a single item.
Instead of showing each individual member separately, you may show the group as a whole. It makes the visualization easier to understand and analyze.
Groups enable data to be organized based on common qualities or criteria within a dimension. To meet your unique analysis needs, you can establish specialized categories or hierarchies.
Custom groups that are not inherent in the data source can be created. This flexibility allows you to construct meaningful groups that meet your analysis needs and make calculations easier.
Some of the features of Sets are given below:
Data subsets can be produced using sets depending on certain criteria, calculations, or member selection. This makes it possible for you to isolate and concentrate on particular data points for a deeper look.
Tableau is capable of handling both static and dynamic sets. As data changes, dynamic sets automatically update. While offering consistency in analysis, static sets remain constant and do not alter unless actively changed.
By enabling users to change set membership in response to their interactions with the visualization, Tableau's set actions enable interactivity.
Sets are useful for advanced filtering. It enables you to concentrate on particular data subsets and do research solely on those subsets.
Creating Group in Tableau
Tableau Groups are used to combine the members of a field. The steps for creating Tableau Groups are as follows:
Step 1: Choose Category from the right-click menu. For creating Tableau Groups, select Create, then Group.
Step 2: The Create Group dialogue box appears. In Tableau, enter the name of the Group data. Select the items to be grouped. Choose the Group option.
Step 3: Tableau Groups are created in the Edit Group Window with actor, actress, and stunt performer combined together in a single group named Acting. Simply click Ok to establish Tableau groups.
This generates Tableau groups using the group name and adds it to the dimension list. This can be used to visualize a group of people in a field using the Tableau approach.
Creating Set in Tableau
When the set data changes, the members of a Dynamic Set change. They have only one dimension. The following steps are needed for creating a dynamic set:
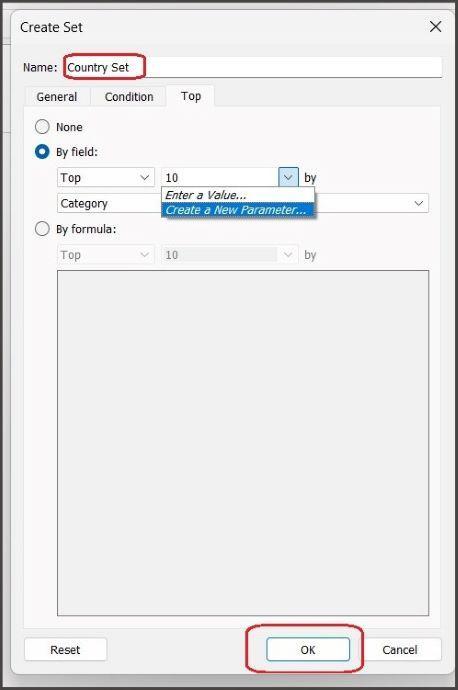
Step 1: Go to the Data Pane, then Dimensions, and then Create > Set.
Step 2: Configure the dimensions in the Create Set box based on the parameters.
General: Use this option to specify one or more values that will be taken into account while computing the set.
Condition: This tab is used to establish rules that determine which values must be included in the set.
Top: This option is used to limit which values must be included.
Step 3: When you've finished configuring all of the options, click OK. The new set appears in the Data Pane under Sets. A set icon is seen. This means that the field is now set.
Difference Between Groups and Sets in Tableau
Some of the differences between groups and sets in Tableau are discussed below:
S.No.
Groups
Sets
1
Groups combine members to conduct more in-depth analyses.
Sets produce subsets for targeted, detailed examination.
2
There can only be one group of members.
Members can take part in many sets at once.
3
Cannot alter group membership dynamically in response to user interactions.
Can use set actions to adjust set membership in an interactive fashion.
4
In groups, computed membership based on formulas is not permitted.
Sets may be computed using rules or formulas.
5
The newly created Group will appear in the same dimension window.
The newly created set appears in a separate window below the measures.
6
Groups are not dynamic.
Sets can be dynamic.
Frequently Asked Questions
Q. What are Filters?
Tableau filters are used to limit the amount of data that can enter a Tableau worksheet, dashboard, or view. Some of the different types of filters are extract filters, context filters, data source filters, etc.
Q. What is data visualization?
The graphical depiction of data or information is referred to as data visualization. We can employ visual items such as graphs, charts, bars, and many others. Data visualization technologies enable users to quickly see and interpret data.
Q. What is TreeMap?
The TreeMap visualization organizes data hierarchically and displays it as a sequence of nested rectangles. Rectangles' sizes and colors correspond to the values of the data points they project. Parent rectangles will be tiled with the elements of their children.
Q. What is Data Modelling?
Data modeling is the analysis of data objects utilized in business or other contexts, as well as the finding of links between these data objects. It is the first stage in developing object-oriented code.
Conclusion
Groups and Sets in Tableau are useful tools for analyzing and manipulating data. In terms of data aggregation and segmentation, it meets a range of needs. This blog explains how to create Groups, Sets, and briefly describes the differences between groups and sets in Tableau.


 8+ registered

