Do you think IIT Guwahati certified course can help you in your career?
Introduction📖
Postman is an API client that allows developers to quickly create, share, test, and document APIs. This is accomplished by allowing users to create, save, and read simple and complex HTTP/s requests.
This article will discuss monitoring your APIs and their uptime in postman.
Monitoring APIs👨🏻💻
Postman monitors provide you with real-time information about the health and performance of your APIs.There are two types of monitors for monitoring the APIs.
Uptime monitors
Collection-based monitors
Once the monitor is activated, you will be notified of any system outages or test failures, allowing you to identify and resolve issues before your API's consumers are affected.
Uptime Monitors💻
You can use uptime monitors to track the availability of an API or website. It is not necessary to create collections, test scripts, or environments. Enter the URL to monitor (HTTP or HTTPS only) and choose which team members should be notified of outages.
The uptime monitor constantly checks the URL's availability, as frequently as every minute (paid plans) or every 15 minutes (free plans). When Postman detects downtime, the appropriate team members are notified via email.
Uptime monitors ensure that your API or service is available around the clock and assist you in detecting system outages more quickly. The monitor's dashboard records uptime statistics, allowing you always to check your API's status, view past trends, and pause the monitor as needed.
Note: Only URLs, API endpoints, and websites publicly accessible over the internet can be monitored by uptime monitors. HTTP and HTTPS are the only protocols supported.
Collection-Based Monitors💻
A collection-based monitor executes a set number of requests from the postman cloud. When you create a monitor, you select a collection of requests to run. These can be simple requests to determine whether an endpoint is operational and reachable. More complex collections can use chained requests, test scripts, and environment variables to validate API responses and functionality.
Depending on your postman plan, you can set your monitors to run as frequently as you like. Monitors can be scheduled to run every five minutes for paid plans. Monitors can be designed to run as frequently as every hour on free plans. You can specify which region of the world you want the collection to run from (paid plans only).
Set up email alerts or integrations to be notified via slack and other channels if a test fails or errors occur. All results are recorded on the monitor's dashboard, allowing you to review previous results or examine trends over time.
Use Cases📋
APIs can be monitored in a variety of ways using collection-based monitors. Here are some examples of what you can do with collection-based monitors:
Examine the API's health and performance: Check that the API is operational in production and other environments.
Validate the structure and data of the API response: Check that the API is working correctly.
Test complex, multi-step workflows: Check that critical API flows and edge cases are functioning correctly.
Conduct user acceptance, smoke, and regression tests regularly: Identify issues ahead of time so that you can address them before they affect API consumers.
Run tests in various environments and regions: Check that your APIs work everywhere. (Running monitors in multiple areas necessitates purchasing a postman plan.)
Keep an eye on your endpoints' security: Continuously test APIs for known security flaws.
Display the outcomes on the monitor dashboard: Improve your understanding of API performance over time and identify trends.
See blogs on web testing.
Monitoring API Uptime👨🏻💻
Uptime monitors continuously check the availability of a single API endpoint, website, or other URL. When there is downtime, you will receive an email notification within one to two minutes. You can also integrate slack to receive downtime notifications.
Let us discuss how to create an uptime monitor.
Creating an uptime monitor👷🏻
Enter the URL and select which team members to notify in the event of a system outage to create a new uptime monitor. You can specify how frequently the monitor checks the URL's availability. You can also set the monitor to operate in multiple regions (paid plans).
Create a new uptime monitor to track the availability of a single API endpoint, website, or other. The uptime monitor sends an email notification to your team whenever there is downtime or when the service is restored.
Following are the steps for creating an uptime monitor:
1. In the sidebar, select Monitors, and then +.
2. In the right pane, click create an uptime monitor.
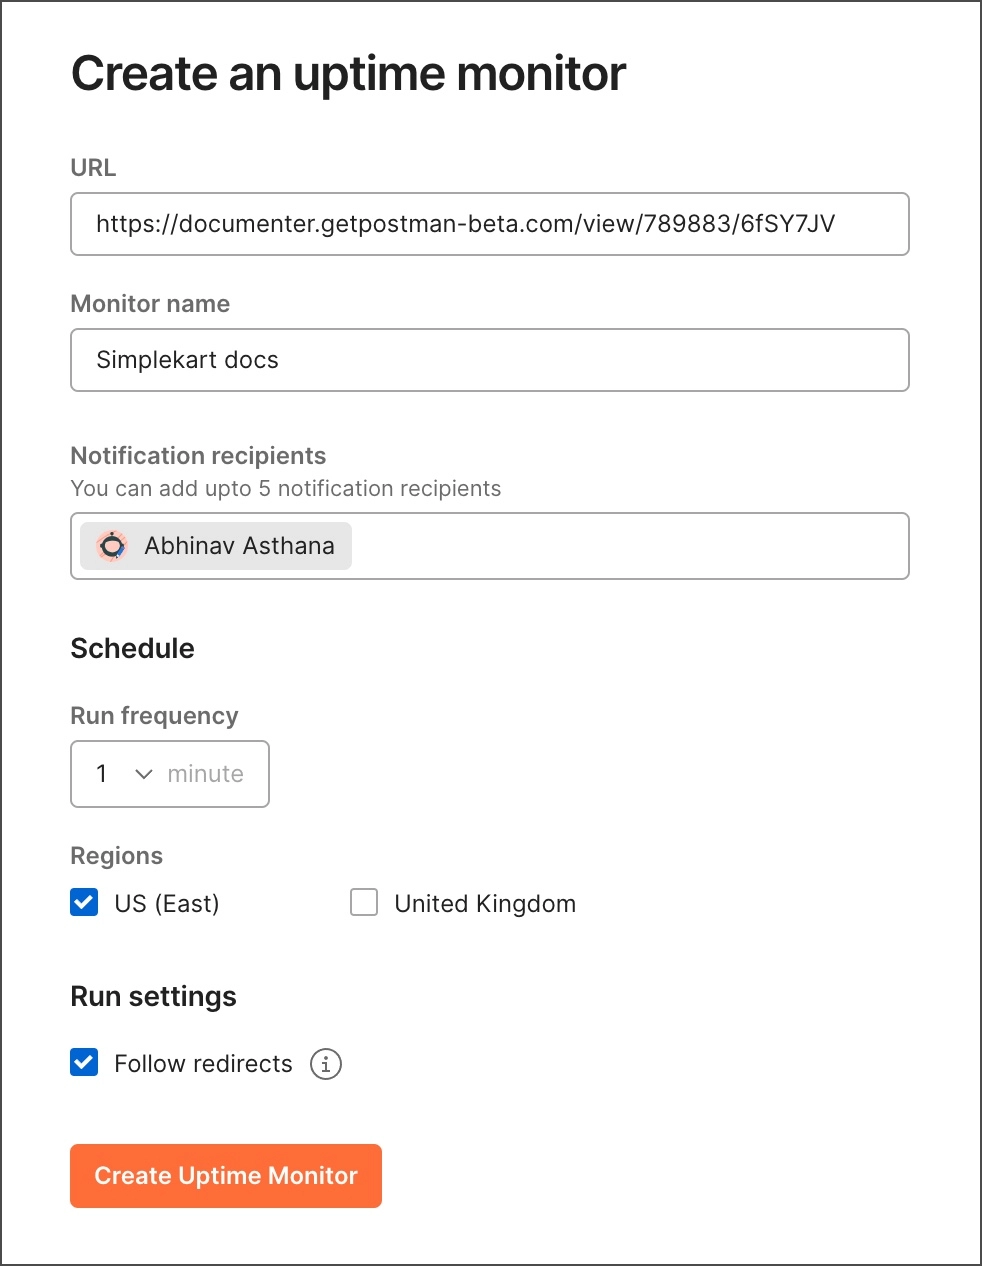
3. Enter the URL to be monitored. The URL, API endpoint, or website to be monitored must be publicly accessible via the internet. HTTP and HTTPS are supported protocols.
4. Enter a descriptive name for the monitor in the monitor name field to help you identify it later.
5. Configure any optional monitor details:
Notification recipients: You can notify up to five members of your postman team when there is downtime.
Run frequency: Choose how frequently the monitor checks the URL's availability, every minute (paid plans) or every 15 minutes (free plans).
Regions: Choose one or more areas from which to run the monitor (paid plans). A notification is sent if any of the selected areas experience downtime. (The region is chosen automatically for free plans.)
Follow redirects: Select this option to avoid classifying redirects as service downtime.
6. Choose create an uptime monitor.
Viewing uptime monitor results👨🏻💻
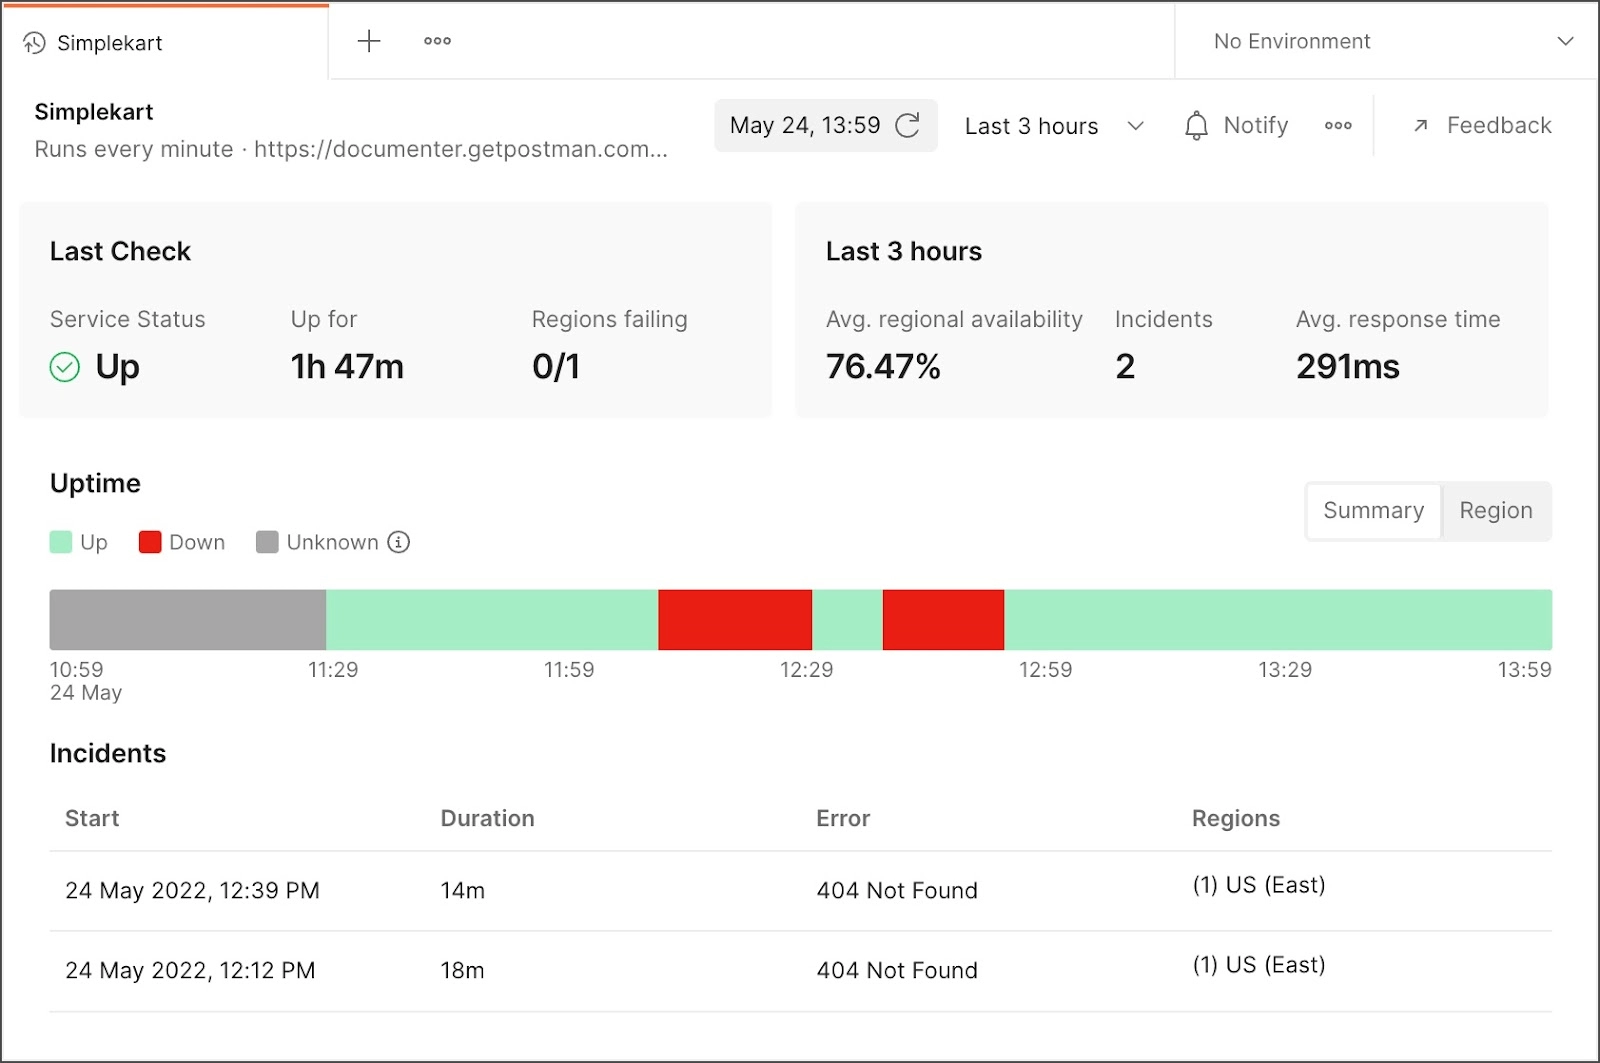
Select monitors in the sidebar, then select a monitor to view its dashboard and results for an uptime monitor. The dashboard displays whether the API endpoint was up or down when it was last checked, how long it was down, and the number of regions where it failed. Select the refresh icon to update the dashboard's most recent monitor status.
The dashboard also displays key statistics for the period selected. The average percentage of time the endpoint has been available in at least one region is shown in milliseconds. You can also see the total number of outages and the average response trends in milliseconds. To change the time displayed, use the upper-right menu to select a different time.
Viewing the uptime graph🔎
The uptime graph displays the status of the monitored endpoint URL during the time selected:
Up(Green): Within the expected response time, the userves traffic and returning 2xx status codes (60 seconds or less).
Down(Red): The URL is not serving traffic, is returning non-2xx status codes, or is taking longer than expected to respond (more than 60 seconds).
Unknown(Grey): Postman cannot determine the URL's status because the monitor is paused, because the monitor did not exist during the displayed time, or for some other unexpected reason.
Viewing downtime incidents🔎
Downtime incidents contain a list of all detected outages. The list displays each incident's start time, duration, error code, and affected region.
Working with Uptime Monitors👷🏼
You can perform the following actions from the monitor dashboard:
Pause an uptime monitor: When the monitor is paused, it no longer makes calls to the specified URL. To pause a monitor, click the more actions icon in the upper right corner and then click pause. Select the more actions icon again and select resume to resume the monitor.
Edit an uptime monitor: When the monitor is paused, it no longer makes calls to the specified URL. To pause a monitor, click the more actions icon in the upper right corner and then click pause. Select the more actions icon again and select resume to resume the monitor.
Delete an uptime monitor: If an uptime monitor is no longer required, remove it. Select delete from the more actions icon at the upper right.
Getting Notified about Downtime🔔
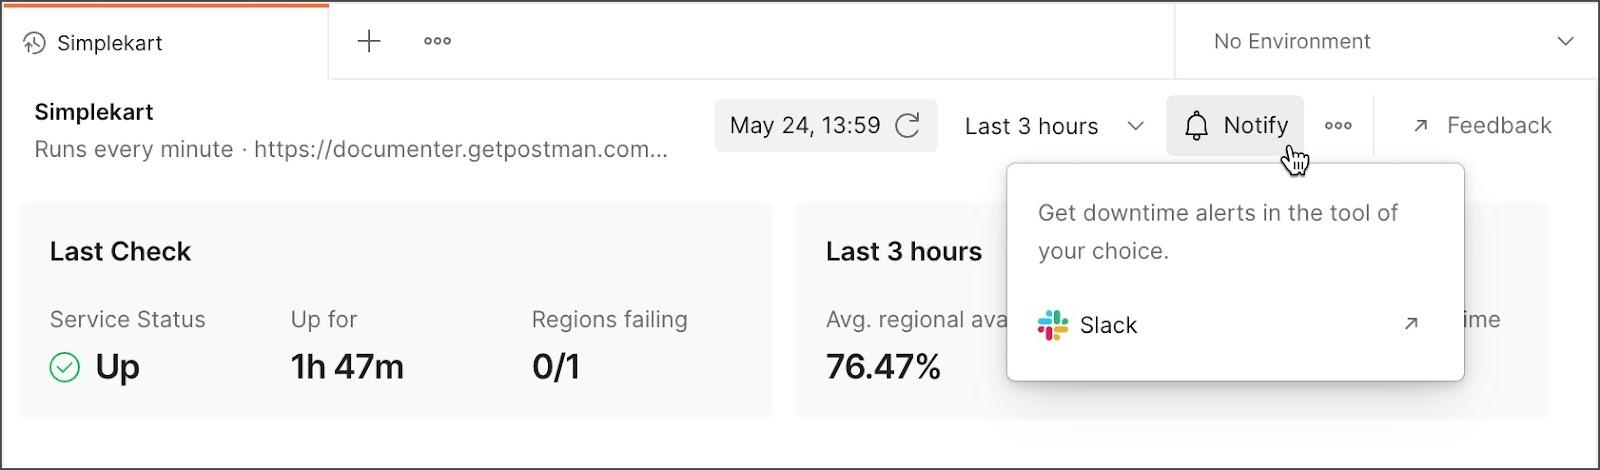
To receive real-time notifications, integrate your uptime monitor with slack. After configuring the integration, you will receive downtime alerts in the slack channel. You'll also be notified when the outage is over.
Select notify from the uptime monitor dashboard.
2. Choose the external link icon. Slack has an external link icon next to it.
3. Select continue to access your slack workspace. Examine the permissions requested and click allow. When you're done, close the browser tab to return to the postman.
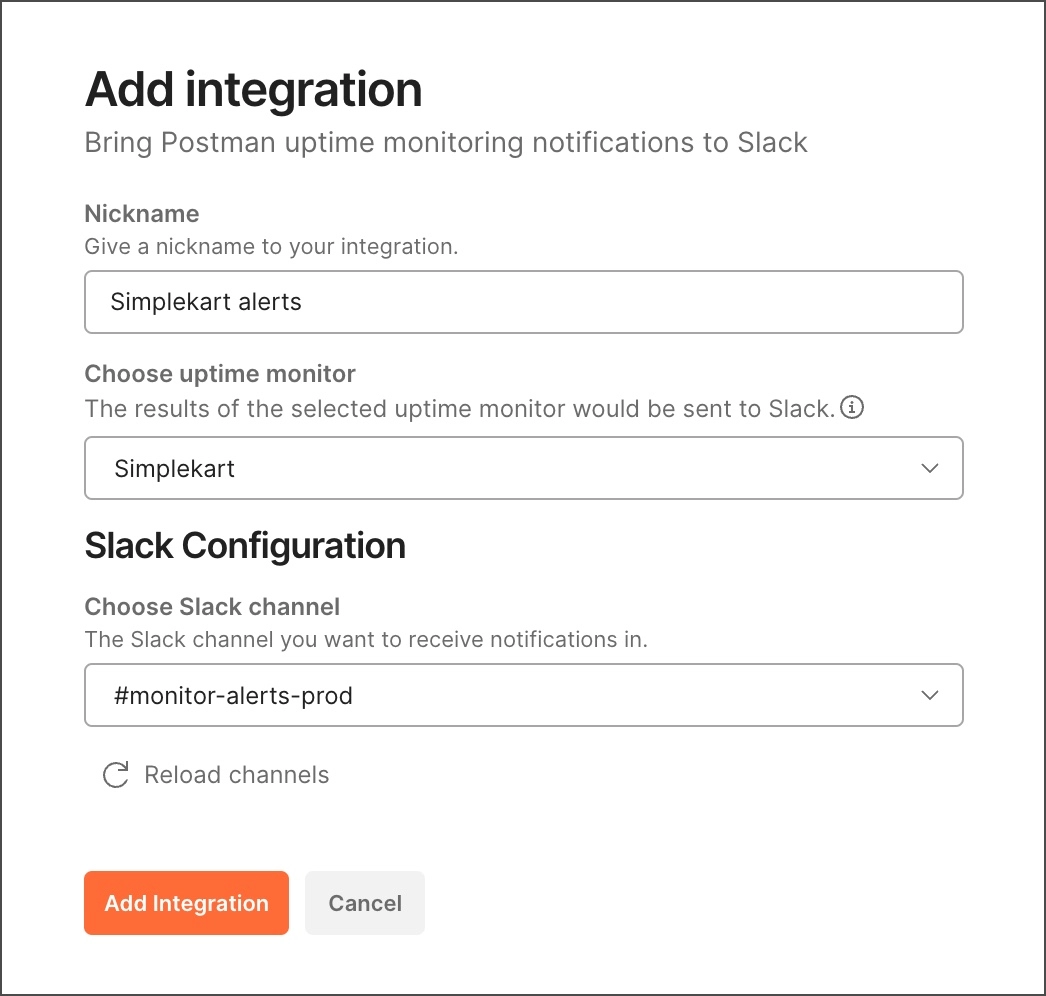
4. Enter a nickname to aid in the identification of the integration.
5. Select the uptime monitor for which you want slack notifications.
6. Choose the slack channel for which you want to receive notifications.
7. Choose add integration.
Uptime Monitor Pricing💵
We can discuss the pricing for uptime under the below two headings:
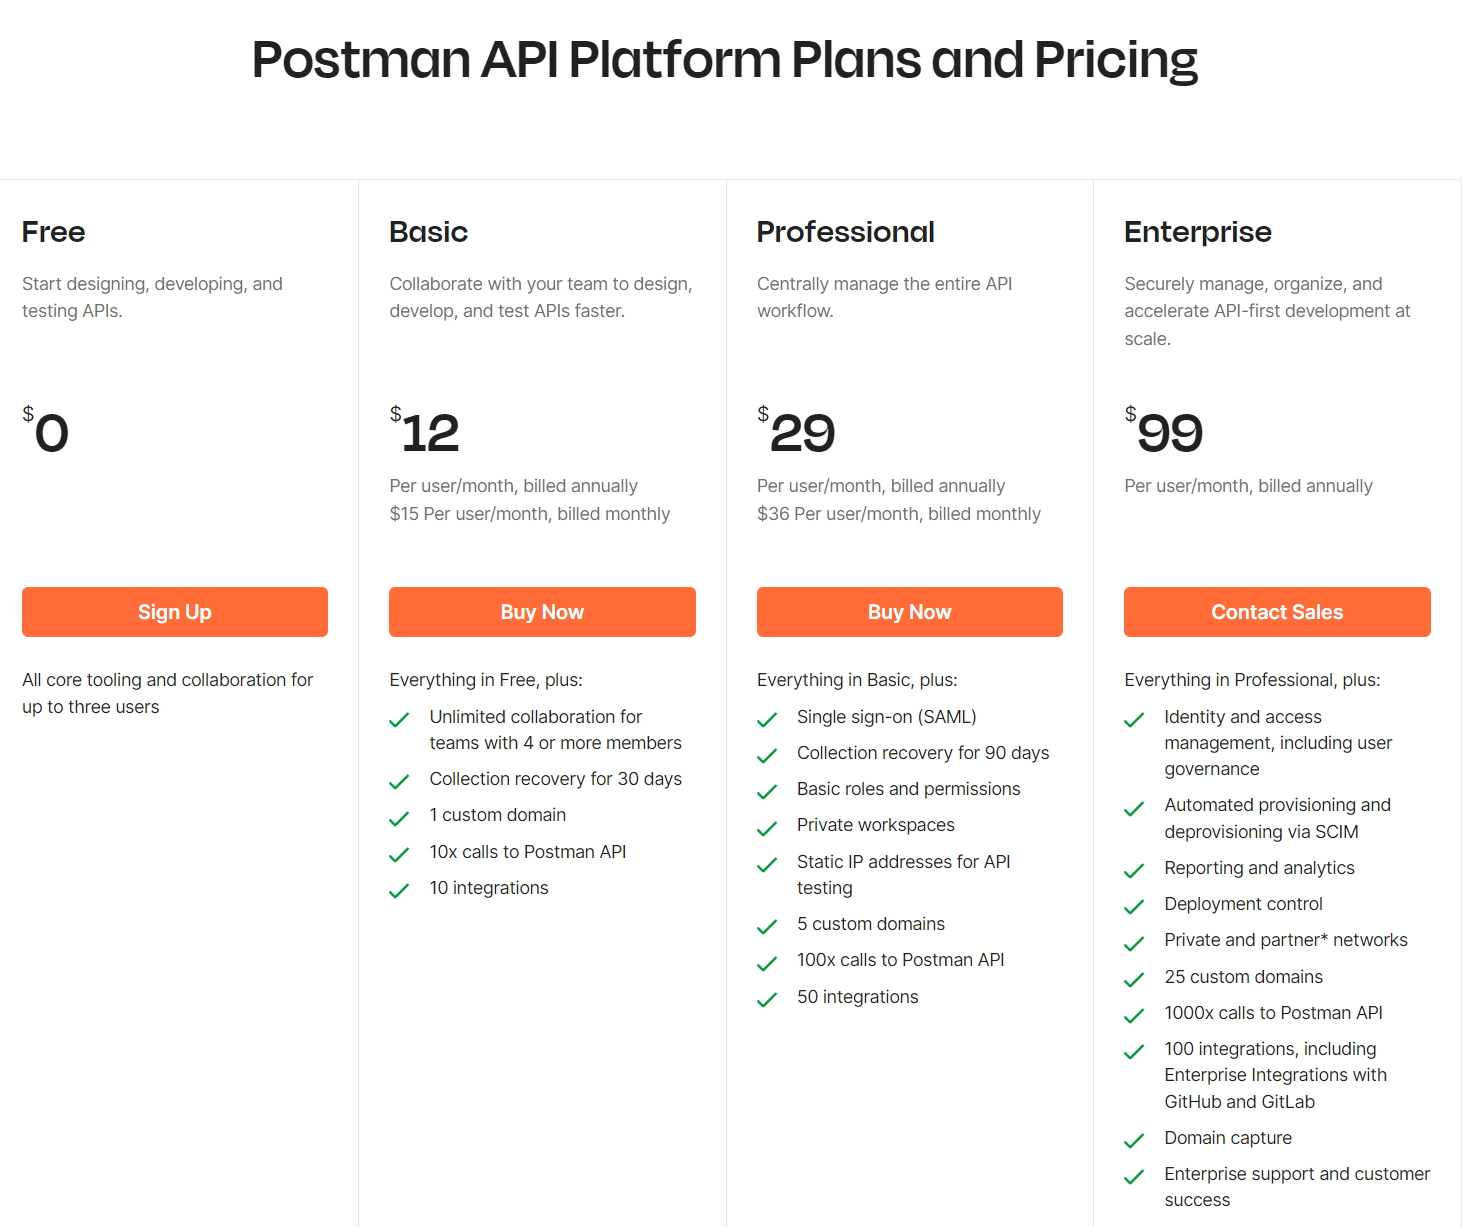
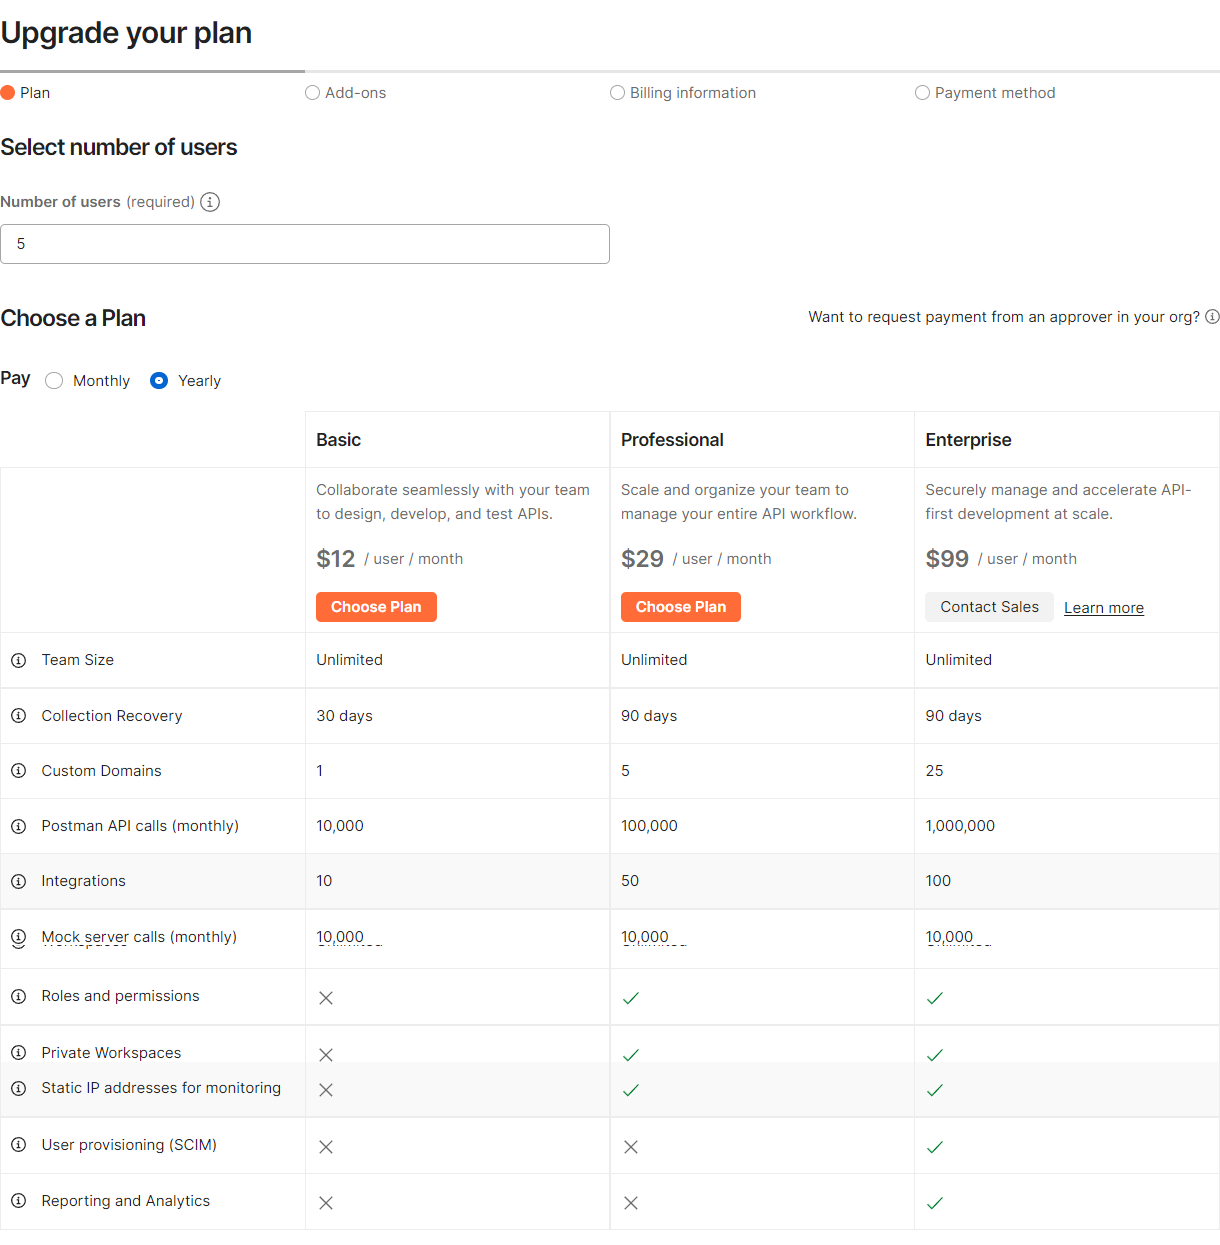
Teams on paid Postman plans can experiment with uptime monitors for free: You can have up to three (Basic plan), five (Professional plan), or nine (Enterprise plan) uptime monitors, including paused monitors, during the open beta period. These free uptime monitors will not count against your team's monthly API monitoring usage limit.
Users on Postman Free plans can also experiment with uptime monitors: You can set up three uptime monitors for free. Remember that these monitors' calls will count toward your team's monthly limit of 1,000 monitoring API calls. You can upgrade your Postman plan or purchase additional monitoring blocks if you need to make more calls.
Frequently Asked Questions
What is a postman?
Postman is an API client that allows developers to quickly create, share, test, and document APIs. This is accomplished by allowing users to create, save, and read simple and complex HTTP/s requests.
What is the purpose of using postman?
Developers can easily create, share, test, and document APIs with Postman, an API client. Users are given the ability to generate, store, and read both simple and complicated HTTP/s requests as well as their responses to achieve this.
Is postman a free software to use?
Sending requests and reviewing answers, building and mocking APIs, testing APIs, monitoring APIs, and many other functions are also available in the free version.
Explain Postman as a testing tool.
An extensive API testing tool that Postman provides makes it simple to put up automated tests. The tests and requests you have made can be combined into a single automatic test sequence.
What distinguishes uptime monitors from collection-based monitors?
Collection-based monitors allow you to run API test scripts, chain together multiple requests and validate critical API flows. In contrast, uptime monitors will enable you to keep an eye on a single API endpoint.
Conclusion
This article extensively discussed how to Monitor Your APIs and Their Uptime in Postman.


 8+ registered

