


Introduction
In this blog, we will see how to do Hyperparameter tuning. Let's say we are trying to classify as SK learn Iris data set based on Petal and sepal width and length we are trying to predict what type of flower it is. The first question that arises is which model I should use. There are so many models to choose from, and let's say we figured out that SVM is the model we want to use. The problem doesn't end there. We have hyperparameters of what kind of Kernel, C, and gamma I should use. There are just so many values to choose from. The process of choosing the optimal parameter from a learning algorithm is called Hyperparameter tuning. Let's jump onto the code without any further discussion for clear understanding.
Implementation
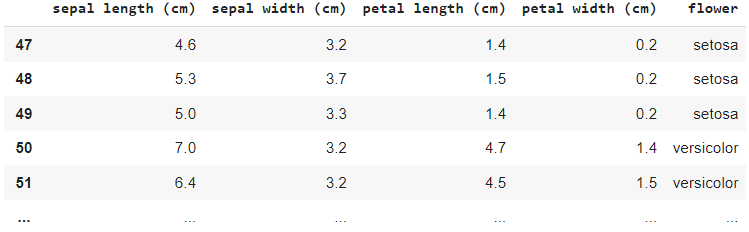
In the Colab notebook, I have loaded the Iris flower data set, which is shown in a table format.
from sklearn import svm, datasets
iris = datasets.load_iris()
import pandas as pd
df = pd.DataFrame(iris.data,columns=iris.feature_names)
df['flower'] = iris.target
df['flower'] = df['flower'].apply(lambda x: iris.target_names[x])
df[47:150]
Output
The traditional approach that we can take to solve this problem is to use the train test split method to split our data set into training and test data sets. Here I am using a 70/30 partition, and I first try the SVM model. Assume that I am going to use the SVM model, and using the SVM model, we can train the model and calculate the score.
from sklearn.model_selection import train_test_split
X_train, X_test, y_train, y_test = train_test_split(iris.data, iris.target, test_size=0.3)
model = svm.SVC(kernel='rbf',C=30,gamma='auto')
model.fit(X_train,y_train)
model.score(X_test, y_test)
Output1
0.9555555555555556Output2
0.8888888888888888
Here, I randomly initialise these parameters. I don't know the best parameter, so I am going with some value. The issue here is that the score might vary based on my train and test set. Now my score is 95%, but if I execute this again, the training and testing sample will change. The output will vary from 95 to 88. I cannot rely on this method because the score is changing based on my model. For that reason, we use K-fold cross-validation.
K-fold Cross-validation
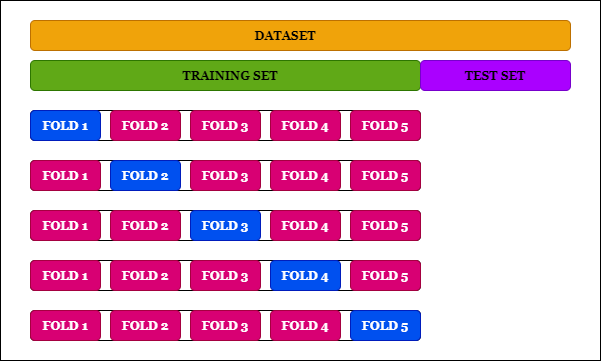
As shown in the diagram, what we do in K-fold cross-validation is divide our data samples into several folds. Here I am offering fivefold, and I take five iterations, and in each iteration, one fold is the test set, remaining our training set. I find the score for that iteration, take these individual scores from each iteration, and make an average. This approach works very well because I am going across all the samples. There is a method called cross Val score, which can tell us the score of each iteration.
(svm.SVC(kernel='linear',C=10,gamma='auto'),iris.data, iris.target, cv=5)Output
array([1. , 1. , 0.9 , 0.96666667, 1. ])
cross_val_score(svm.SVC(kernel='rbf',C=10,gamma='auto'),iris.data, iris.target, cv=5)Output
array([0.96666667, 1. , 0.96666667, 0.96666667, 1. ])
cross_val_score(svm.SVC(kernel='rbf',C=20,gamma='auto'),iris.data, iris.target, cv=5)Output
array([0.96666667, 1. , 0.9 , 0.96666667, 1. ])
Here, I have tried to cross well five times. So my CV is equal to five. I tried this method on different values of Kernel (linear, RBF, etc.) and C. For each of the combinations, I found the scores. These are the five values shown in the output. We can see that these are the scores from five iterations. We can take the average of these scores and determine the average score, and we can determine the optimal value for this parameter. But we can see that this method is very manual and repetitive because we can supply so many discounts as a combination of kernels, and the C, C could be 1,2,3, or even a hundred. So, how many times are we going to write this line?. We can do the same thing in other ways but use a loop. I have my possible values of Kernel and C; then, I run a for loop on both of these. When I execute this, I will get some scores.
kernels = ['rbf', 'linear']
C = [1,10,20]
avg_scores = {}
for kval in kernels:
    for cval in C:
        cv_scores = cross_val_score(svm.SVC(kernel=kval,C=cval,gamma='auto'),iris.data, iris.target, cv=5)
        avg_scores[kval + '_' + str(cval)] = np.average(cv_scores)

avg_scores
Output
{'rbf_1': 0.9800000000000001,
 'rbf_10': 0.9800000000000001,
 'rbf_20': 0.9666666666666668,
 'linear_1': 0.9800000000000001,
 'linear_10': 0.9733333333333334,
 'linear_20': 0.9666666666666666}
By looking at the values, it is clear that rbf1 and the importance of C are either one or 10, or linear Kernel and C being one will give me the best score. So this way, I can find out the optimal score using hyperparameter tuning. We can see that this approach also has some issues, which is if I have four parameters, for example, then I have to run four loops, and it will be too many iterations, and it's just not convenient. Luckily, SK learn provides an API called grid search CV, which will do the same thing as the above code.
from sklearn.model_selection import GridSearchCV
clf = GridSearchCV(svm.SVC(gamma='auto'), {
    'C': [1,10,20],
    'kernel': ['rbf','linear']
}, cv=5, return_train_score=False)
clf.fit(iris.data, iris.target)
clf.cv_results_
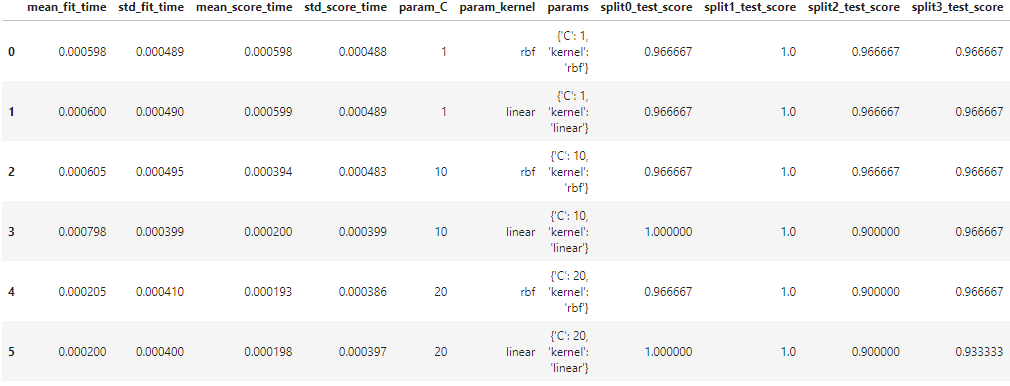
CV results are not easy to view, but SK-learn to download these results into a data frame. Create a Pandas data frame and then supply CV results as an input.
df = pd.DataFrame(clf.cv_results_)
print(df)
Output

 9+ registered

