Table of contents
1.
Introduction
2.
Definition
3.
Domain and Range of Identity Function
4.
Properties Of Identity Functions
5.
Graph of an Identity Function
6.
FAQs
7.
Key Takeaways
Last Updated: Mar 27, 2024

Identity Functions

Author Akash Nagpal
1 upvote
Career growth poll
Do you think IIT Guwahati certified course can help you in your career?

Introduction

An identity function is a function with the same output as the input. An identity function is also known as an identity map or relation. 

When a function returns the same value as the output used as its input, it is called an identity function.

Definition

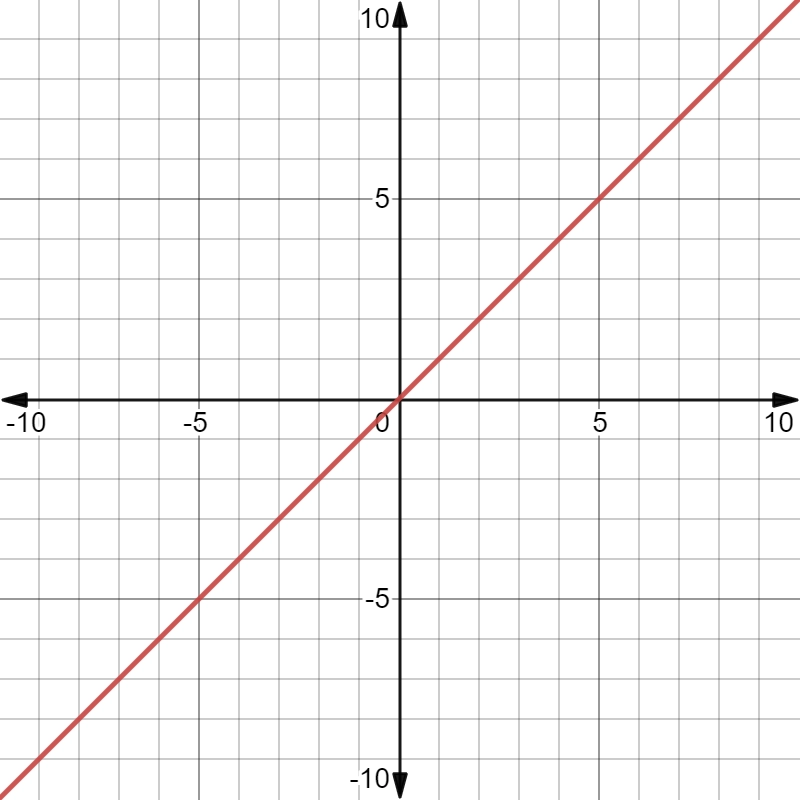
If each element of set A has an image on itself, f (a) = a ∀ a ∈ A, the function f is termed the identity function. It is symbolised by the letter 'I'.

Since the image of elements in domain is identical to the output in the range, it is termed an identity function. As a result, an identity function is a function that directs each actual number to itself. An identity function's output is the same as its input. Since the pre-image and the picture are similar, identity functions are easily detected.

For Example: 

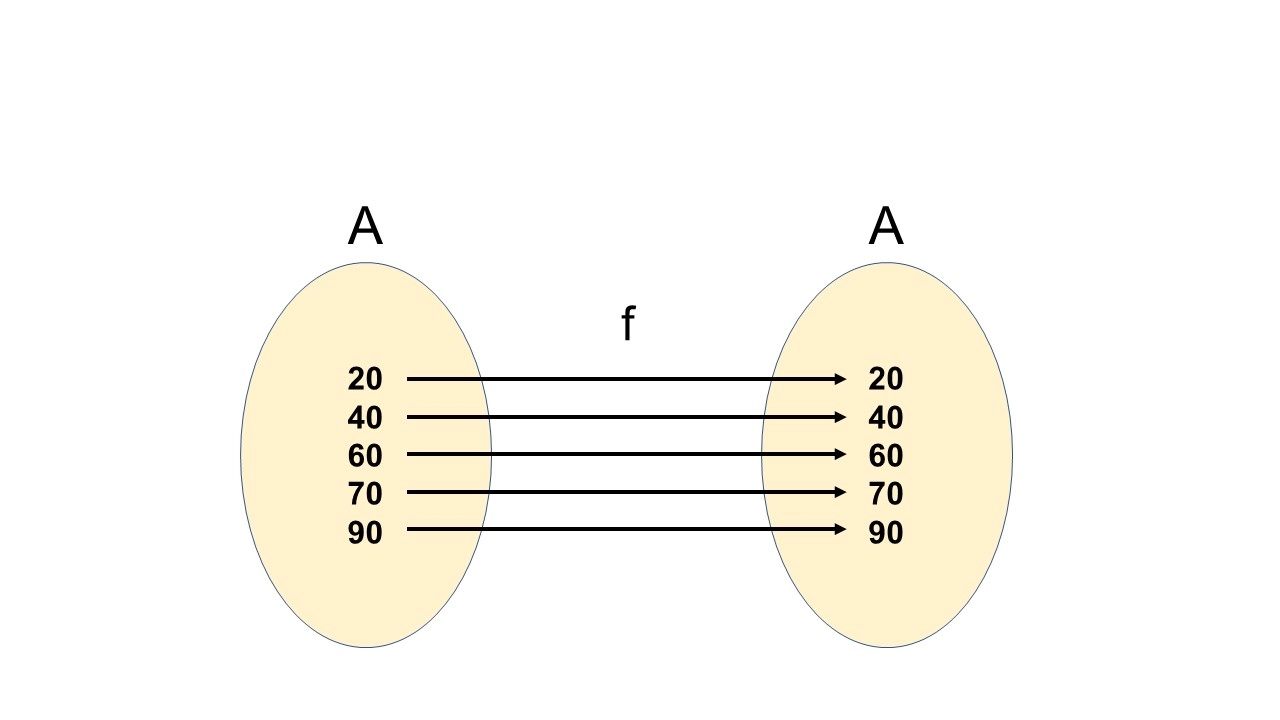
Consider, A = { 20, 40, 60, 70, 90 }

f: A → A such that  

f = {(20 , 20), (40 , 40), (60 , 60), (70 , 70), (90 , 90)}


Domain and Range of Identity Function

An identity function is a real-valued function that has the form f: A → A such that f(x) = x, for each x ∈ A. Here, A is a set of real numbers and is the domain of the function 'f'. The range, as well as the domain of identity functions, are the same. If the input is 4.6, the output is also 4.6; if the input is 0, the output will be 0.

Therefore, we can conclude that: 

  • The identity function g(x) has the domain R.
  • R is the range of the identity function g(x).
  • An identity function's co-domain and range are both equal sets. So identity functions are One-to-one types of functions.

Properties Of Identity Functions

  • The identity function is a linear function with real values.
  • In these functions, the x-axis and y-axis intersect at a 45° angle in the graph.
  • Since the function is bijective, it is the inverse of itself.
  • An identity function's graph and its inverse are identical.

Graph of an Identity Function

We will plot the values of x-coordinates on the x-axis and the values of y-coordinates on the y-axis to plot the graph of an identity function. An identity function's graph is a straight line passing through the origin and making an angle of 45 degrees between the x-axis and the slope.


FAQs

  1. What is a One-to-One Function?
    One-to-one functions are special functions that return a unique range for each element in their domain, i.e. the results are never the same. For example, the function f(x) = x - 5 is a one-to-one function as it gives a different answer for every different input.
  2. How Is the Slope of Identity Functions calculated?
    For an identity function, the domain is equal to the range. Due to this very reason, its slope will always be m=1 and it will form a 45-degree angle with the X-axis.


Key Takeaways

In this article, we have discussed the Identity Functions, Domain and Range of an Identity Function, Properties as well as the graph of Identity Functions. Check out the topic Mathematical Induction for further references.

We hope that this blog has helped you enhance your knowledge regarding Mathematical Induction and if you would like to learn more, check out our articles on Coding Ninjas Blog site and visit our Library for more. 

Do upvote our blog to help other ninjas grow. Happy Coding! 


Live masterclass