


Introduction
Image compression is a sort of data compression used to reduce the size of digital photos without compromising the image's quality. More photos can be saved in a given disc or memory space because of the smaller file size. It also cuts down on the time it takes to send or download images from web pages over the Internet.
Smaller image sizes are also better for your hosting subscription. They take up less storage space, allowing you to store more stuff. Furthermore, backing up your website is a considerably faster procedure when your website’s photos are compressed.
To provide exceptional results, this takes advantage of visual perception and image data's statistical features.
Lossy vs. Lossless Image Compression
Lossy image compression is a technique for shrinking image files by removing some data. This is an irreversible process, which means the data in the file will be permanently deleted.
Lossless image compression, unlike lossy compression, does not degrade image quality. Because lossless compression only removes non-essential data added by the device used to take the shot, this is the case.
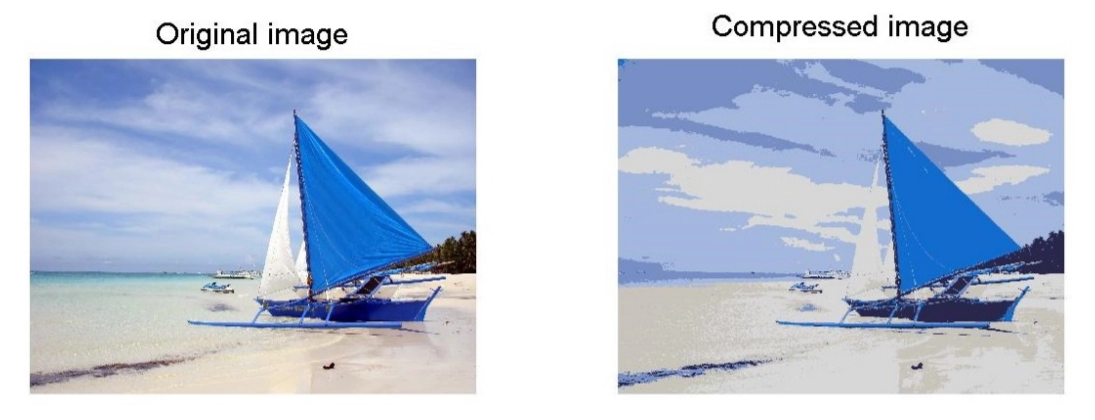
As the title says, we'll use K-means clustering to quantize the colors in the image, which will aid with compression.
K-Means Clustering
Clustering is an unsupervised learning technique that can investigate data structures. Clustering is the division of data into numerous clusters, each containing one or more identical pieces of information. The clustering algorithm demands the highest similarity between data from the same collection and the slightest resemblance between data from different clusters. The clustering algorithm, unlike classification learning, is an unsupervised learning method. The clustering method doesn't need to identify the sample categories; instead, it splits the data set into many clusters based on sample similarity. As a result, the data clusters are not specified but instead defined by the similarity of the samples' properties. As a result, there is no need to pre-mark the incoming cluster data.
It's essentially a search technique for finding 'k' clusters in a set of data points. It selects k-cluster centers at random first, then seeks to minimize the sum of the squared distance of data points from the cluster center within each cluster using some distance metric (for example, Euclidean distance).
This algorithm follows two basic steps:
- Assignment step: For each data point cluster is decided according to the center of it.
- Update step: The data points assigned to the new clusters are used to calculate new centroids.
Note: The data point is the RGB form of colors present in the image.
source: link


 8+ registered

