Do you think IIT Guwahati certified course can help you in your career?
Introduction
Alerting lets you know when there are issues with your cloud applications so you can fix them right away. An alerting policy in Cloud Monitoring specifies the situations and methods for which you should be notified. The alerting guidelines are summarized on this page. Metric-based alerting policies keep track of the metrics data that Cloud Monitoring collects. Most of the Cloud Monitoring documentation on alerting policies uses metric-based alerting policies.
You can also establish log-based alerting policies that inform you when a specific message appears in your logs. These regulations do not rely on metrics. This article will discuss alerting, types of alerting policies, the behavior of metric-based alerting policies, and how to add severity levels to alerting policies.
Let’s dive into the article for more detail on alerting.
How alerting works
The following are the details for each alerting policy:
Conditions specify when one or more resources are in a situation that necessitates your response. Although you can set up a policy that contains several states, an alerting policy must have at least one condition.
As an illustration, you could set up a condition like this:
The HTTP response latency is higher than two seconds for at least five minutes.
In this illustration, the condition determines when you must answer based on the metric HTTP response delay values. The resource, or combination of resources, must be in a state that necessitates your response for the condition to be true.
Channels for notifications that specify who should be informed when action is necessary. An alerting policy may include several notification channels. Cloud Monitoring supports Cloud Mobile App and Pub/Sub along with standard notification channels. See Notification options for a complete list of supported channels and details on how to set them up.
For instance, you could set up an alerting policy to send an email to my-support-team@example.com and post a message to the #my-support-team channel in Slack.
Information that you want to be mentioned in a notification. Variables, Markdown, and plain text are supported in the documentation field.
You may, for instance, incorporate the following material into your alerting policy:
## HTTP latency responses
This alert originated from the project ${project}, using
the variable $${project}
The conditions of a metric-based alerting policy are continuously monitored by Monitoring when it is configured. The conditions cannot be configured only to be observed during specific times.
Monitoring creates an incident and delivers a notification when the policy requirements are satisfied. An overview of the event, a link to the Policy details page so you may look into it, and any supporting material you supplied are all included in this message.
When a metric-based policy's requirements are no longer met while an incident is still active, Monitoring automatically closes the incident and notifies the user of the closure.
Example
You deploy a web application on a Compute Engine virtual machine (VM) instance currently running a web application. Although you anticipate that the HTTP response latency will vary, you still want your support team to reply if the application experiences excessive latency for an extended period.
You develop the following alerting policy to make sure that your support team is informed when your application has excessive latencies:
Open an incident and contact your support staff via email if the HTTP response latency is more significant than two seconds for at least five minutes.
This alerting strategy requires keeping track of the HTTP response latency. The criteria is met, and an incident is produced if this delay is more than two seconds consistently for five minutes. The criterion is not satisfied, or a brief spike does not trigger an event in latency.
Due to increased demand, your web application's response time exceeds two seconds. Your alerting policy will react as follows:
When Monitoring gets an HTTP latency measurement greater than two seconds, a five-minute countdown is set in motion.
The timer runs out if the subsequent five latency measurements are more than two seconds apart. When the timer goes off, Monitoring declares the condition to have been satisfied, creates an incident, and emails your support staff.
The member of your support staff who received the email logs into the Google Cloud dashboard confirmed that they had received the message.
Your support staff can address the reason for the lag by using the documentation in the notification email. The HTTP response latency is less than two seconds after a few minutes.
Monitoring resolves an incident and notifies your support team that it has been closed when it receives an HTTP latency measurement of fewer than two seconds.
A new incident is opened, and a notification is delivered if the latency exceeds two seconds and continues to exceed that level for five minutes.
How to add an alerting policy
Using the Google Cloud dashboard, the Cloud Monitoring API, or the Google Cloud CLI, you may create a metric-based alerting strategy for your Google Cloud project:
When using the Google Cloud console, you can enable a suggested alarm or create your alert by beginning on the Alerts page of Cloud Monitoring.
There are accessible recommended notifications for several Google Cloud products. The only configuration necessary for these alerts is the addition of notification channels. For instance, the Pub/Sub Lite Topics page contains links to alerts set up to send you an email when your subscription quota is about to be reached. Similar to this, the VM Instances tab in Monitoring provides links to alerting policies that are set up to track those instances' network latency and memory usage.
Using the Cloud Monitoring API or the Google Cloud console, you can examine and edit any policy that you establish with the Google Cloud console. The Cloud Monitoring API enables you to develop alerting strategies that keep track of metric ratios. You cannot access or amend these policies when they employ Monitoring filters using the Google Cloud panel.
You can make, view, and edit alerting policies directly using the Google Cloud CLI or the Cloud Monitoring API. Using the Google Cloud CLI or the Cloud Monitoring API, you may define conditions that keep an eye on a ratio of metrics. Utilizing Monitoring Query Language (MQL) or Monitoring filters, you can provide the ratio using the Cloud Monitoring API. See Metric ratio for an illustration of a policy that employs Monitoring filters.
The Google Cloud console and the Cloud Monitoring API enable an expressive, text-based language that Cloud Monitoring supports. Create Alerting Policies Utilizing Monitoring Query Language (MQL) for details on using this language with alerts.
Use the Logs Explorer in Cloud Logging or the Monitoring API to implement a log-based alerting strategy for your Google Cloud project. See Monitoring your logs for details on log-based alerting policies.
How to manage to alert policies
See the following for instructions on how to access a list of your project's metric-based alerting policies and how to change those policies:
Making use of the Google Cloud console to manage to alert policies
Using the Cloud Monitoring API or Google Cloud CLI to manage to alert policies
See Using log-based alerts for more on managing log-based alerting policies.
Authorization required to create alerting policies
The roles or permissions needed to create an alerting policy are described in this section. Access control has further information on Identity and Access Management (IAM) for Cloud Monitoring.
Each IAM role is assigned a name and an ID. When defining access control, role IDs are supplied as parameters to the Google Cloud CLI and take the form of roles/monitoring.editor. See Granting, modifying, and canceling access for additional details. Names of roles, including Monitoring Editor, are displayed in the Google Cloud console.
Required Google Cloud console roles
Your IAM role name for the Google Cloud project must be one of the following to build an alerting policy:
Monitoring Editor
Monitoring Admin
Project Owner
Required API permissions
Your IAM role ID for the Google Cloud project must be one of the following to utilize the Cloud Monitoring API to construct an alerting policy:
roles/monitoring.alertPolicyEditor: The basic minimum permissions required to develop an alerting policy are provided by this role ID.
roles/monitoring.editor
roles/monitoring.admin
roles/owner
Determining your role
Use the Google Cloud console to identify your project role by performing the following actions:
Select the Google Cloud project after launching the Google Cloud console:
Go to the Google Cloud console
You can click IAM & admin to see your role. On the same line as your username is your role.
Contact the administrator of your organization to learn more about your organization-level permissions.
Costs associated with alerting policies
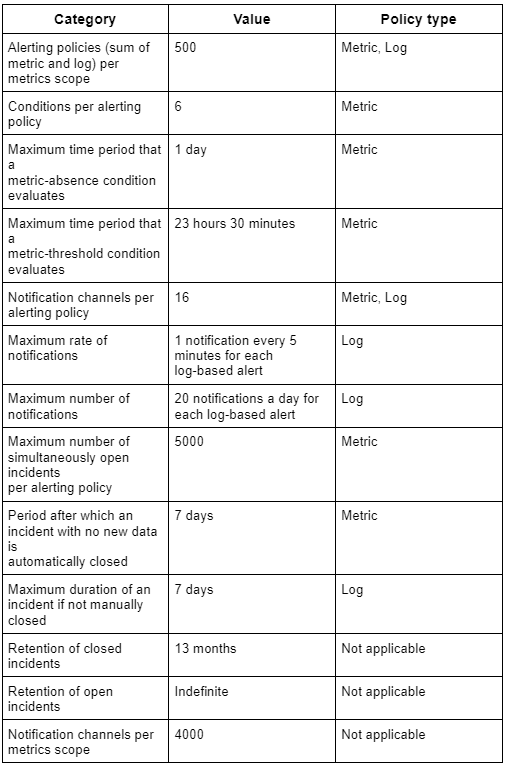
Use of alerting policies or uptime checks is free, although the following restrictions do apply:
Types of alerting policies
This document includes JSON samples for several metric-based alerting strategies and describes them in detail. Alerting policies outline three conditions to look out for: Some metrics act in a certain way over a certain amount of time. For instance, when a metric's value exceeds a certain threshold or when it fluctuates too quickly, an alerting policy might be triggered.
Metric-absence condition
A metric-absence condition is triggered when there are no values for a particular time window in a monitored time series.
Note: Metrics associated with TERMINATED or DELETED Google Cloud resources are not considered for metric-absence policies, except for metrics produced by an uptime check. Using metric-absence policies, you cannot test for terminated or deleted Google Cloud VMs. Additionally, uptime generates check-results metrics while running whether an uptime check succeeds or fails. As an illustration, this means metrics like monitoring.googleapis.com/uptime_check/check_passed shouldn't be alerted to by metric-absence.
Metric-absence conditions demand at least one productive measurement or one that retrieves data within the maximum time frame following the installation or modification of the policy. If you use the Google Cloud console, the maximum adjustable duration window is 24 hours; if you use the Cloud Monitoring API, it is 24.5 hours.
Consider the scenario where the duration window for a metric-absence policy is set to 30 minutes. When the component that writes metric data has never written a data point, the condition won't occur. The subsystem must produce at least one data point before ceasing all data production for 30 minutes.
Metric-threshold condition
When a metric's values for a given duration window are more significant than or less than the threshold, a metric-threshold condition is triggered. For instance, a metric-threshold condition might be fulfilled when the CPU utilization is greater than 80% for at least 5 minutes.
Patterns that fit into one of the following main sub-categories are found within the class of metric-threshold conditions:
When values in a time series increase or drop by a specified percentage or greater throughout a period window, rate-of-change requirements are met.
This condition computes the percent-of-change on the time series before comparing it to the threshold.
The condition averages the metric's values for the previous 10 minutes, then compares the result to the average for the 10 minutes taken immediately before the duration window. A metric rate of change condition uses a 10-minute lookback window, a fixed value that cannot be altered. However, when establishing a condition, you define the time window.
Group-aggregate conditions are triggered when a metric calculated across a resource group exceeds a threshold for a duration window.
When an uptime check cannot correctly respond to a request from at least two different locations, uptime-check conditions are set off.
Process-health conditions are triggered when the number of processes executing on a VM instance is greater than or fewer than a threshold. These conditions can also be set up to monitor a collection of instances with similar names. The Ops Agent or the Monitoring Agent must be running on the monitored resources for this condition type to exist.
When the ratio of two metrics exceeds a threshold for a duration frame, metric-ratio conditions are triggered. These conditions compute the ratio of two metrics, such as the proportion of HTTP error responses to all HTTP responses.
Note: The Google Cloud console includes all alerting rules, but unless the policies employ Monitoring Query Language, you must use the Cloud Monitoring API or the Google Cloud CLI to create, view, or amend ratio-based policies.
The behavior of metric-based alerting policies
This document explains how alerting rules combine numerous criteria, how they replace missing data points, and how the alignment period and duration settings influence when a condition occurs. A policy's maximum number of open incidents, the average number of notifications sent for each incident, and the reasons for notification delays are also covered.
Alignment period and duration settings
When defining a condition for an alerting policy, you must set two fields: the alignment period and the duration window. The definitions of these domains are briefly illustrated in this section.
Alignment period
A lookback period from a specific time is the alignment period. For instance, if the alignment period is five minutes at 1:00 PM, the samples received between 12:55 PM and 1:00 PM are included in the alignment period. The samples collected between 12:56 PM and 1:01 PM are included in the alignment period, which slides by one minute at that time.
The Rolling window and Rolling window function menus in the New condition dialogue allow you to customize the alignment fields.
Consider a condition that monitors a metric with a sample time of one minute to show how the alignment period affects a condition in an alerting policy. Assume that the aligner is set to sum and that the alignment duration is five minutes. The requirement is said to be met or active when the time series' aligned value exceeds two for at least three minutes. Assume for this example that the condition is assessed every minute.
Duration window
You utilize the duration or duration window to prevent a condition from being satisfied due to a single measurement. You can set the duration window by using the Retest window parameter in the Configure trigger step. Each time measurement doesn't meet the condition; the duration window is reset. The following illustration of this behavior is:
Example: This policy stipulates a five-minute timeframe.
If the time it takes for an HTTP response to arrive is longer than two seconds, and if that time exceeds the five-minute criteria, you should open an incident and contact your support staff via email.
The sequence that follows demonstrates how the duration window influences the assessment of the condition:
Less than two seconds pass between HTTP requests.
HTTP latency exceeds two seconds during the following three minutes.
The condition resets the duration window when the latency in the subsequent measurement is less than two seconds.
The criterion is satisfied, and the policy is activated for the following five minutes, where HTTP latency exceeds two seconds.
Set the length window such that it is both long enough to reduce false positives and brief enough to guarantee that incidents are opened promptly.
Select the alignment period and duration window
Conditions under the alerting policy are assessed on a fixed basis. The time window and alignment period options you select do not affect how frequently the condition is evaluated.
The above graphic shows that the number of data samples paired with the aligner depends on the alignment period. Pick an extended period if you want to mix plenty of examples. Select a brief duration to limit the interval to just one sample. On the other hand, the duration window outlines how long the aligned values must exceed the threshold before the condition is satisfied. Set the duration window to 0 to allow the condition to be satisfied when a single aligned value is higher than the threshold.
Policies with multiple conditions
Up to six conditions can be included in an alerting policy.
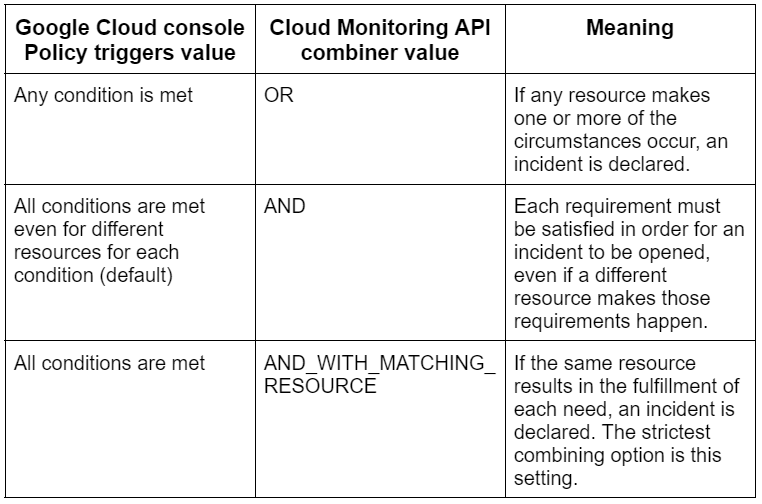
You must specify when an incident is opened if you're utilizing the Cloud Monitoring API or if your alerting policy has multiple circumstances. The Multi-condition trigger step allows you to configure combiner options.
The following table contains each parameter in the Google Cloud console along with its corresponding value in the Cloud Monitoring API and a brief description:
Example
Consider a Google Cloud project with two VM instances, vm1 and vm2. Assume that you develop an alerting policy with the following two conditions:
The instance's CPU utilization is tracked by the condition "CPU usage is too high." The requirement is fulfilled when any instance's CPU utilization exceeds 100 ms/s for a minute.
Excessive utilization is a condition that keeps track of how much CPU each instance is using. The requirement is satisfied when an instance's CPU usage exceeds 60% for one minute.
Assume at first that neither of the conditions is true. Next, assume that vm1's CPU consumption for a minute surpasses 100 ms/s. The condition that CPU utilization is too high is met because it has exceeded the threshold for one minute. Any criterion completed in combination with the other conditions results in the occurrence of an incident. An incident won't be formed if all conditions are satisfied, including those for different resources for each condition, or if all conditions are satisfied overall. Both requirements must be met to use these combiner options.
Next, imagine that vm2's CPU usage will be higher than 60% for a minute and that vm1's CPU usage will continue to be greater than 100 ms/s. As a result, both requirements are satisfied. Depending on how the circumstances are brought together, the following describes what happens:
Any condition is met: When a resource fulfills a condition, an incident is caused. In this case, vm2 makes the requirement for Excessive Utilization true.
An incident is also triggered if vm2 results in the condition that CPU utilization is too high to be met. Because the events that cause vm1 and vm2 to cause the condition CPU use is too high to be met are separate, an incident is started.
All conditions are met even for different resources for each condition: Both requirements must be satisfied for an occurrence.
All conditions are met: This combiner requires that the same resource trigger all conditions; therefore, an incident is not generated. Because vm1 causes CPU consumption to be too high to meet requirements while vm2 causes excessive utilization to be fulfilled, no incident is triggered in this scenario.
Partial metric data
Monitoring identifies time series data as missing when it stops or is delayed, preventing policies from alerting and incidents from being closed. Data arrival delays from third-party cloud providers can reach 30 minutes, with delays of 5 to 15 minutes being the most typical. A protracted delay that exceeds the duration window can result in the occurrence of "unknown" situations. Monitoring could have forgotten part of the most recent history of the conditions by the time the data is eventually received. Because there is no indication of delays once the data is received, a later examination of the time-series data may fail to identify this issue.
When data stops coming in, Monitoring assesses metric-threshold circumstances using two customizable fields:
Utilizing the Evaluation missing data field you set in the Condition trigger stage, you can configure how Monitoring determines the replacement value for missing data. When the retest time frame is set to No retest, this field is disabled.
Use the Incident auto close duration field to specify how long Monitoring should wait after data stops before closing an open incident. In the Notification stage, you can specify the auto-close duration. Seven days is the standard auto-close duration.
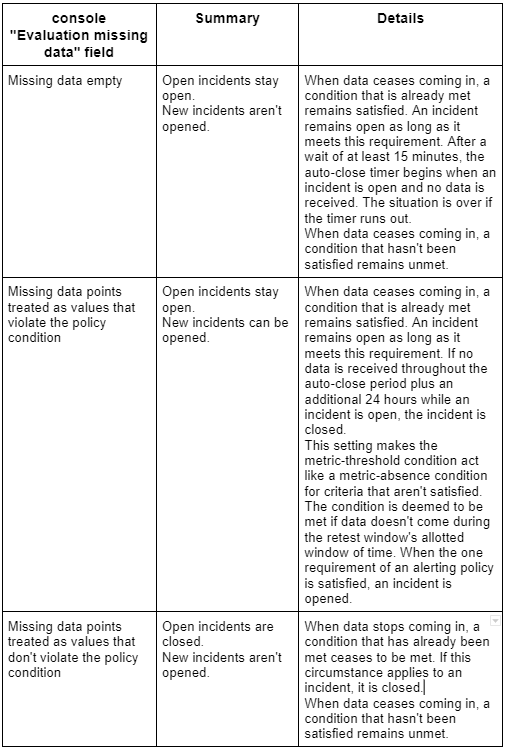
The various choices for the missing data field are described as follows:
You can reduce issues brought on by missing data by carrying out any of the following:
Get in touch with your third-party cloud provider to find out how to lower metric collecting latency.
When applicable, use longer-length windows. Your alerting policies will be less responsive if you use a more prolonged period window.
Choose metrics with a shorter collection delay:
Monitoring agent metrics, particularly when the agent is executing on VM instances in external clouds.
When you directly send their data to Cloud Monitoring, custom metrics.
If logs collection is not postponed, logs-based metrics.
Notifications and incidents per policy
When an alerting policy is disabled, neither incidents nor notifications are generated for the policy.
It is possible to create incidents and send notifications when an alerting policy is activated. The number of open incidents a policy can handle is limited, and this section explains when you might receive several alerts for the same issue.
Number of open incidents per policy
A problem affecting all resources could set off an alerting policy that applies to numerous resources, opening incidents for each resource. An incident is opened for each time series that causes a condition to be satisfied. A single policy can only open 5000 incidents simultaneously to avoid overtaxing the system.
Consider a policy that, for example, affects 2000 (or 20,000) Compute Engine instances, and each instance results in the alerting requirements being satisfied. The monitoring cap is set at 5000 open incidents. Until any of the open incidents for that policy are resolved, any remaining requirements that are met are disregarded.
Note: If you have an incident open for an alerting policy and the time series that caused it crosses the condition threshold once again. In contrast, the incident is still available; another incident will not be opened. In an alerting policy, Cloud Monitoring only keeps one open incident for each time series.
Number of notifications per incident
A notification is automatically sent out when a time series fulfills a condition. Any of the following circumstances could result in multiple notifications being sent to you:
Multiple time series monitoring is a condition.
Multiple conditions are included in a policy:
All conditions are met: When all requirements are satisfied, the policy generates an alert and creates an incident for each period that causes a requirement to be satisfied. Consider, for illustration, a policy with two criteria, each monitoring a different time series. You see two instances and get two notifications when this policy is activated.
Any condition is met: Every time a brand-new set of conditions is satisfied, the policy sends a message. Consider the scenario where Condition A is satisfied, an incident occurs, and a notification is sent. Another message is delivered if the incident is still active when a subsequent measurement satisfies Conditions A and B.
Note: When the policy has numerous conditions, you cannot set up Cloud Monitoring to create a single event and send a single notification.
When a condition is met and when it no longer is, alerting policies set with the help of the Cloud Monitoring API let you know. When an incident is opened, alerting policies defined with the Google Cloud console send you a notification by default. When an incident is resolved, you are not informed. Notifications of incident closure can be enabled.
Note: Using the Monitoring API will not allow you to modify how incident-closure notifications are delivered.
Notifications for disabled alerting policies
By turning off and on the policy, alerting policies can be momentarily suspended and then resumed. For instance, you can turn off the alerting policies that watch over a virtual machine (VM) before performing maintenance.
Disabling an alerting policy stops it from opening or closing incidents, but Cloud Monitoring continues to assess the conditions and record the outcomes. After you disable an alerting policy, silence the associated occurrences to resolve any outstanding issues.
Monitoring evaluates the values of all conditions throughout the most recent duration window, which may include information obtained before, during, and after the stopped interval when a deactivated policy is re-enabled. Even with long windows, policies can start immediately after being resumed.
Let's say, for instance, that a monitored operation needs to be down for 20 minutes. If the process is immediately restarted and the alerting policy is enabled, Monitoring detects that the process hasn't been active for the past five minutes and creates an issue.
Notification latency
The time elapsed between when a problem first arises and when a policy is activated, is known as notification latency.
The following activities and configuration choices influence the overall notification latency:
Metric collection delay: The amount of time required by Cloud Monitoring to gather metric values. Most metrics for Google Cloud values take 60 seconds to become available after collecting, but this varies depending on the metric. Calculations for the alerting policy incur an additional delay of 60 to 90 seconds. The visible lag for AWS CloudWatch measurements can last for many minutes. This can take an average of two minutes for uptime tests (from the end of the duration window).
Duration window: The time window is set up for the circumstance. Only when conditions are true for the window period are conditions said to be met. The notice is delayed by at least five minutes from when the event first happens, for instance, when the duration window is set to five minutes.
Time for notification to arrive: Network or other latency (unrelated to the content being sent), sometimes approaching minutes, may be experienced via notification channels like email and SMS. There is no assurance that messages will be delivered on some channels, including SMS and Slack.
Add severity levels to an alerting policy.
This section explains how to add user-defined labels to an alerting policy and how to use them to organize your notifications and occurrences.
About labels
Labels are key-value pairs connected to incidents, alerting rules, and time series. Metric labels, resource labels, and user-defined labels are all available. Specific details about the metric being collected or the resource against which the measure is written are contained in the labels for both metrics and resources. On the other hand, user-defined labels are those that you make and keep information tailored to your needs.
Labels are added to time-series data when written to provide information about the data. For instance, a virtual machine (VM), a zone, a Google Cloud project, and a particular device type might be identified by the labels on a time series. You can add user labels to occurrences and alerting policies:
An alerting policy's label has a static value. See Create static severity levels for an example showing how to add a label with the critical value.
When using the Cloud Monitoring API or the Google Cloud console, you can add these labels to an alerting policy:
Google Cloud Console: Utilize the preview alerting interface to create policy labels. There are options for policy labels on the page where you configure notification channels and documentation. Create an alerting policy for additional details.
Cloud Monitoring API: Use the userLabels field of the AlertPolicy object in the Cloud Monitoring API to add policy labels. See Managing alerting policies by API for further details.
A label's value can be dynamically set for an incident. In other words, the label value can be determined by the value of the time-series data. See Create dynamic severity levels with Monitoring Query Language for an illustration (MQL).
When you provide the condition of an alerting policy using MQL, you can define these labels.
Since labels are part of notifications, you may use them to rank your alerts for investigation by adding labels that describe the seriousness of an incident.
View labels in notifications
The details page of an event, the details page of an alert policy, and some notifications all allow you to view the labels of the incident or alert policy:
You add labels to a policy listed in the Policy labels section of email notifications. Still, labels that you add to an incident are listed in the Metric labels section.
The labels you add to an alerting policy or incident are included in the JSON data in PagerDuty, Webhooks, and Pub/Sub notifications. The policy user labels field of the JSON structure contains a list of alerting policy labels:
"policy_user_labels": {
  "severity": "critical",
}
The JSON structure's metric field contains incident labels:
As was previously mentioned, the metric field includes the metric type, display name, labels, and any user-defined labels that have been added to the incident.
Example: report severity level with labels
Two examples are given in this section to demonstrate how labels can be used to convey severity information in a notification.
Let's say you want to be alerted when a virtual machine's CPU usage goes above a certain level, and you want the message to include the following severity information:
critical: CPU utilization is at least 90%.
warning: CPU utilization is at least 80% but less than 90%.
info: CPU utilization is at least 70% but less than 80%.
Create static severity levels
Three alerting policies are created. You set a threshold for the CPU utilization for each policy's condition so that it will activate. Additionally, you add a severity label to each policy, the value of which sets the policy's threshold.
Because labels on alerting policies have unchanging values, you construct three policies. For each label's value, you must therefore build a separate policy.
Policy A: When the CPU use reaches at least 90%, the criterion is met. Critical is the set severity level:
"userLabels": {
   "severity": "critical",
}
Policy B: When the CPU use reaches at least 80%, the requirement is met. The warning level of severity is selected:
"userLabels": {
   "severity": "warning",
}
Policy C: When the CPU use reaches at least 70%, the criterion is met. The label for severity is set to info:
"userLabels": {
   "severity": "info",
}
In this example, you get three notifications—one from each policy—when the CPU usage goes above 90%. Using the severity label's value, you can choose which event to look into first.
Monitoring immediately dismisses all open occurrences when the CPU utilization drops to a value of under 70%.
Create dynamic severity levels using MQL
Use a single policy when creating incident labels, and let the data's value dictate the label's value that will be included in the notification. In other words, you are not required to develop a unique alerting policy for each value your label may have.
Note: You must change the default settings that govern how Monitoring handles events when data stops coming in if the data's value impacts the label's value. The Best practices section of this publication includes a description of these settings.
Take the MQL query that includes the Severity label, for instance:
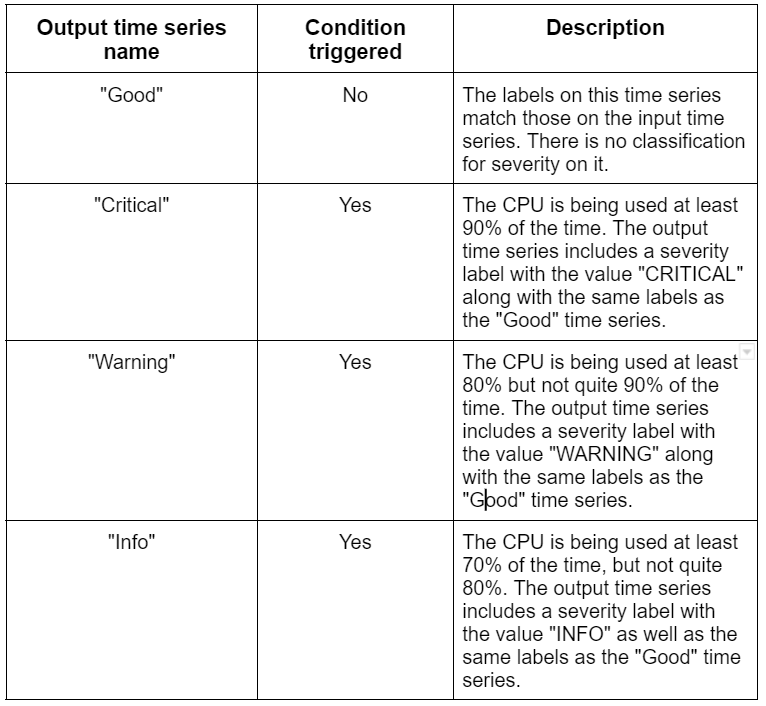
When the condition is met, the policy handler generates a time series by processing the CPU usage data. The criterion in the preceding example is met when the CPU utilization is at least 70%. The policy handler can produce one of four-time series for each input time series:
The policy handler's time-series data is fed into the incident manager, which decides when incidents are opened and closed. The incident manager uses the duration, evaluationMissingData, and autoClose values to determine when to close an incident.
Best practices
When you construct labels whose values are dynamically set, take the following actions to guarantee that no more than one incident is open at once:
Override the default values for the following properties in the MetricThreshold object:
duration field: Enter a number that is not zero.
evaluationMissingData field: When data stops, incidents are closed thanks to the evaluationMissingData area. You should set this parameter to EVALUATION_MISSING_DATA_INACTIVE when using the Cloud Monitoring API. Set the field to "Missing data points considered as values that don't break the policy requirement" when using the Google Cloud console.
Set the autoClose field in the AlertStrategy object to the minimum duration of 30 minutes. When using the Cloud Monitoring API, you should provide 30m in this parameter.
Incident flow
When the alert policy is created, the CPU utilization data is lower than 70%. The order in which incidents are opened and closed is shown below:
The policy handler generates the "Good" time series and doesn't open any incidents because the CPU utilization measurements are below 70%.
Next, suppose that the CPU usage reaches 93%. The policy handler switches from producing data for the "Good" time series to producing data for the "Critical" time series.
When the incident manager notices a new time series, the "Critical" time series that sets off the condition, it produces an incident. The severity label for the notification has the value CRITICAL.
Assume that 75% of the CPU is being used. In place of continuing to produce the "Critical" time series, the policy handler now produces the "Info" time series.
When the incident management notices a brand-new time series, the "Info" time series, which sets off the condition, creates an incident. The severity label for the notification has the value INFO.
The "Critical" time series has an open incident, and the incident manager notices that no data is coming for it. The incident manager closes the event linked to the "Critical" time series because the policy is set up to close incidents when data stops arriving. Only the incident with a severity label value of INFO is left open.
Finally, let's say that the CPU usage drops to 45%. The policy handler switches from producing the "Info" time series to producing the "Good" time series because this value is below all thresholds.
The incident management notices that an incident is open for the "Info" time series and that no data is coming in for it. The incident is closed because the policy is configured to the suggested parameters.
If you don't use the suggested value for the evaluationMissingData parameter, active incidents won't be instantly closed when the data stops coming in. As a result, the same input time series may have many open incidents.
Frequently Asked Questions
What does alerting accomplish?
People may stay updated on the information that matters most thanks to alerts. The most prevalent usage of the service is for machine-to-person communication, with alerts often given through a notification system.
What distinguishes alerting from monitoring?
The most straightforward kind of monitoring is the display of metrics through dashboards and reports. Alerts need action, such as resuming a service, notifying a person, updating a log, etc.
What is a tool for alert monitoring?
IT professionals can monitor servers to track information about their performance, health, and status, including CPU load, memory usage, active processes, and disc space levels.
What do monitoring and metrics mean?
Software metrics quantify a software's properties in a quantifiable way. Because of this, monitoring the metrics plays a significant role in the development phase. During the development and deployment phases, monitoring system metrics aim to ascertain the product's or process's quality.
Conclusion
In this article, we have extensively discussed the introduction of alerting in GCP. We have also explained how alerting works, authorization required to create alerting policies, the types of alerting policies, and other details.


 9+ registered

