Do you think IIT Guwahati certified course can help you in your career?
Introduction
Tableau Dashboards are a collection of various views or visualizations, each of which displays a distinct type of data at the same time. It provides customers with a comprehensive picture of all data on a single screen. It's as simple as dragging views from the sheets section to the visualization area to create a dashboard.
In today's data-driven environment, visualization and reporting are essential elements. Tableau is one of the leading and widely used tools in the industry. This blog post will go through an Introduction to Dashboard in Tableau and make you better understand this section.
What is Tableau?
Tableau is a very powerful data visualization application. It is used by data analysts, scientists, statisticians, and others to visualize data and form clear opinions based on data analysis. Tableau is well-known for its ability to quickly process data input. It provides the necessary data visualization output. It may transform your data into insights that will guide your future actions. Tableau can do all of this while maintaining the highest level of security. It promises to address problems with security as soon as they are identified by users or occur on their own.
You can prepare, clean, and format data of various kinds and ranges with Tableau. You can then produce data visuals to get useful insights that you can impart to other users. Tableau allows you to conduct data queries to gain insights from your visualizations as well as maintain metadata.
Advantages of Tableau
Following are some of the advantages of Tableau:
You can generate beautiful and detailed data visuals from data that was unorganized. It makes complex data easier to understand and uncover patterns, trends, and insights.
You can look at the data from multiple perspectives to see if any patterns emerge. You can ask open-ended questions and perform numerous comparisons to gain surprising insights.
It has a user-friendly approach. Thus it is simple and intuitive that even a layperson can use it. Its drag-and-drop capability allows you to easily create interactive dashboards and reports.
Tableau can connect to a variety of data sources. It includes data warehouses and files that contain diverse data. These are stored on many types of storage media.
Tableau is built to efficiently handle huge datasets. It ensures rapid performance even when working with massive amounts of data. It optimizes queries and makes use of in-memory processing to provide fast visuals.
What is a Dashboard in Tableau?
A dashboard is a centralized display of several spreadsheets and related data in one place. It is used to compare and track multiple pieces of data at the same time. The many data views are all displayed at the same time. Dashboards are bottom-of-the-spreadsheet tabs that are often updated with the most recent data from the data source. A dashboard can contain views from any worksheet in the workbook, as well as a range of supporting objects such as text sections, websites, and photographs. Each view you add to the dashboard is associated with the worksheet to which it belongs. As a result, changing the worksheet updates the dashboard, and changing the dashboard's display updates the worksheet.
Tableau Dashboards are a grouping of multiple views or visualizations that each display a particular sort of data. It gives customers a complete image of all facts on a single screen. To construct dashboards, just drag views from the sheets section to the visualization area. Creating a dashboard includes more than just utilizing Tableau's visualization tools. A dashboard should present the most important details, allowing the user to digest information rapidly.
Features and Applications of Dashboard
Some of the features of the Dashboard are discussed below:
Dashboards display data using graphs, charts, and other visual components for simple comprehension.
Dashboards show real-time statistics, ensuring that the information is accurate and timely.
Users can study precise details, filter information, and interact with the data through dashboards.
Users may access dashboards from any device and view them whenever and wherever they want. Tableau dashboards are mobile-optimized and deliver a responsive and user-friendly experience on smartphones and tablets.
Tableau dashboards offer numerous customization choices, including color schemes, layouts, and interactivity settings. It allows the users to personalize the dashboard design to their individual demands.
The dashboard has many applications, some of which are given below:
Dashboards monitor important metrics and performance indicators to aid in making wise decisions.
Dashboards help in the visualization of consumer interactions and the improvement of engagement tactics.
Dashboards gather data for analysis and make reporting easier.
Dashboards give a summary of the status of a project, its timeframe, and its resource allocation.
In healthcare organizations, Tableau dashboards are used to visualize and analyze patient data as well as track medical outcomes.
Creating a Dashboard in Tableau
The following steps are needed to create a dashboard in Tableau:
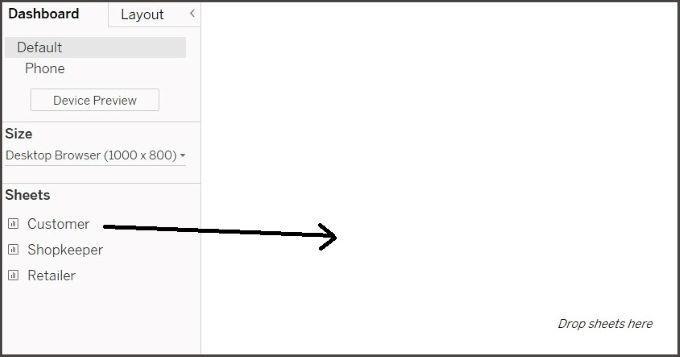
Step 1: In the Menu bar, select Dashboard. Choose a New Dashboard and change the name of the Dashboard to meet your needs.
Step 2: Drag sheets onto the Dashboard from the left panel. To make visualizations, select the sheet and upload your data.
Step 3: Add the second sheet to your dashboard by dragging it there. You can include as many sheets as you need.
Step 4: Filters, Slicers, row dividers, Column dividers, and more features can be added to customize your dashboard.
After you've finished customizing your dashboard, you can view it in full-screen mode by hitting F7 as a shortcut, or in Presentation Mode.
What is the Use of Dashboard in Tableau?
Some of the uses of Dashboard in Tableau are discussed below:
Dashboards allow users to see all of the progress, visualizations, and information on one page or screen, giving them a quick peek at all of the data without having to navigate to different tabs or screens.
Dashboards resize charts as objects on the screen, which are then positioned as Tiled objects using the simple drag-and-drop capability.
Tableau dashboards give teams a central location to access, communicate with, and work together on shared data, promoting effective data collaboration.
The dashboard can be sized based on the given options: Automatic, Exact, Range, and Pre-sets.
Frequently Asked Questions
Q. How to publish Tableau reports to Tableau Server?
Open the workbook that you wish to send to Tableau Server. Ensure that you are on a working sheet that will be transmitted to the server. Sign in to your Tableau server account after clicking "Publish Workbook," and give it the name you want it to have on the server.
Q. How to display an axis in Tableau?
You have the option of displaying or hiding an axis. To remove the axis, right-click it and uncheck "Show header." To restore the hidden axis, right-click on a row or column's fields and select "show header."
Q. What are marks in Tableau?
A Marks card can give different colors based on a category and vary the size of a line, circle, or bar in the chart based on any measured value, which helps add information to the chart. Marks cards are often used to mark charts and provide details to views.
Q. What is a workbook in Tableau?
A workbook is a complete collection of sheets, dashboards, and stories created on Tableau desktop or public, saved on your local system, and published on Tableau public. You can obtain the Tableau public worksheet by following the link to its website.
Conclusion
Tableau dashboards include strong data visualization tools, real-time updates, customizability possibilities, interactivity, and cross-platform compatibility. This blog gives an introduction to Dashboard in Tableau, its applications, and features and briefly shows the steps for the creation of a dashboard in Tableau.


 8+ registered

