Do you think IIT Guwahati certified course can help you in your career?
Introduction
The Apache HTTP Server Project intends to develop and maintain an accessible, open-source HTTP server. It delivers HTTP services through a safe, effective, and adaptable server. It is made entirely of Java and is intended to load test functional functionality and track performance.
What are Listeners?
As a JMeter sampler component runs, listeners visually represent the data obtained about those test cases. The test's listeners can be changed at any point, even under the test plan. They are more complex than that, though. Performance engineers can track the requests JMeter sends and evaluate the answers to the system under test returns as they work with statistical data like distribution and percentage or aggregate time and capacity-related data. The option to save findings to a file is almost universal among JMeter listeners, allowing them to convert results to the format required for analysis.
Only JMeter elements at or above the level of the JMeter Listener will be used to gather data. The JMeter listeners provide the outcomes of our test plan execution. Jmeter offers results in several formats, including a tree, graph, table, primary text, etc.
We can choose the listeners based on the requirements of our script.
Adding JMeter Listeners to Test Plan
Adding listeners to the test plan is similar to adding a thread group. Test results are shown here.
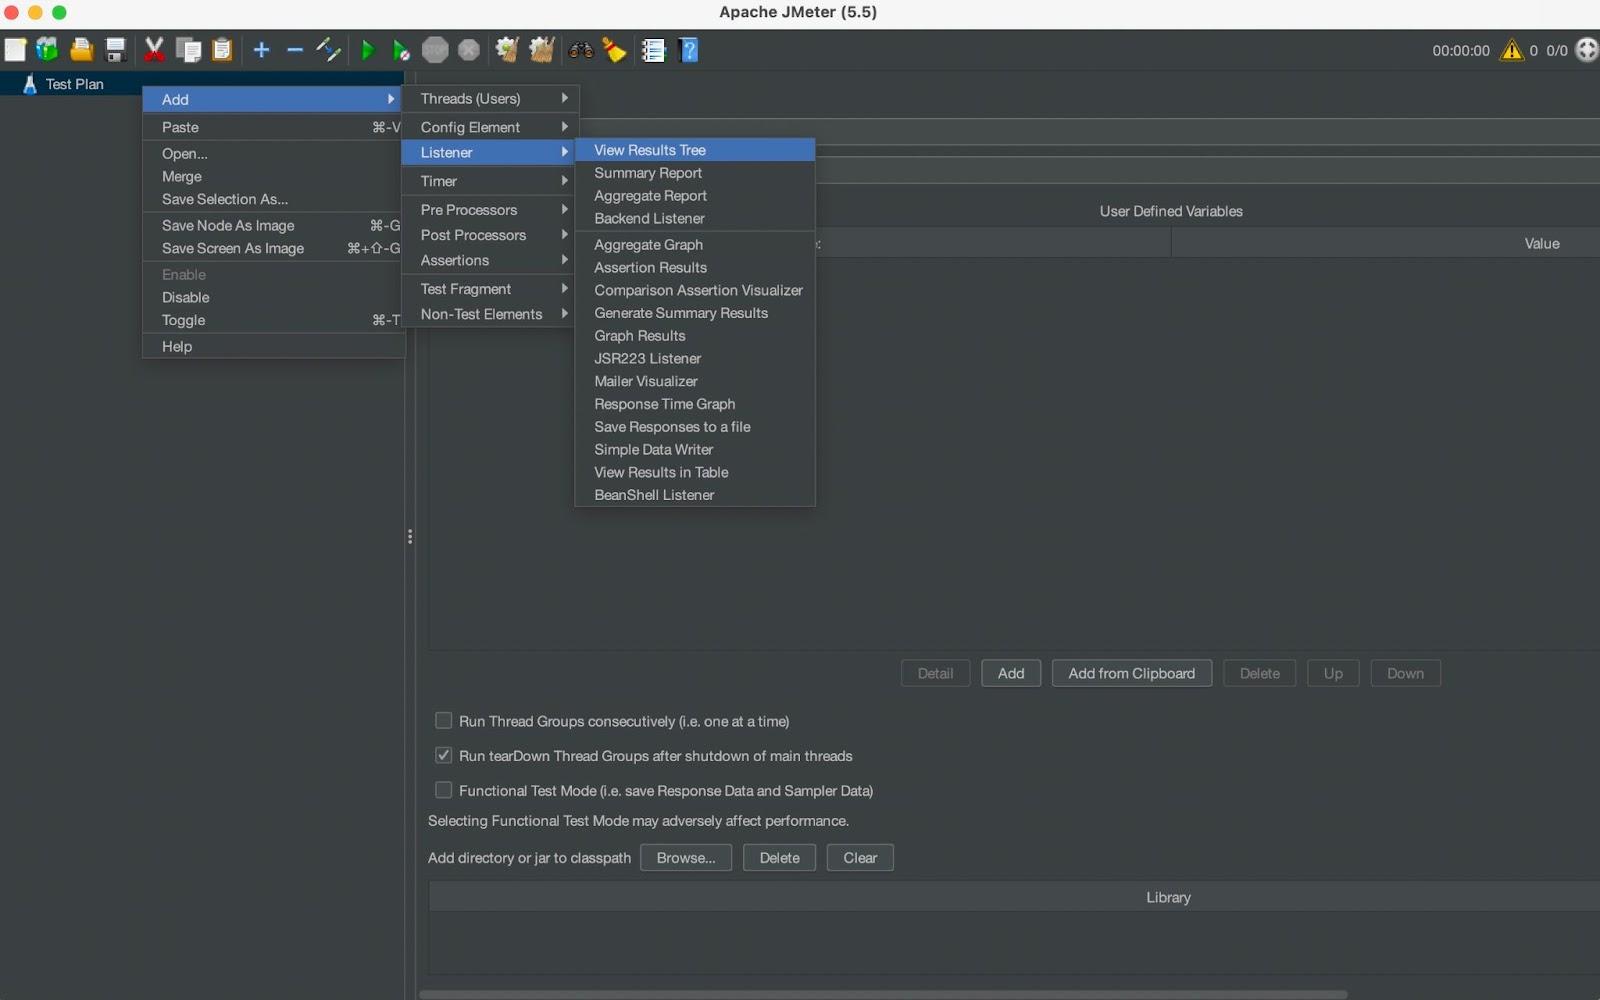
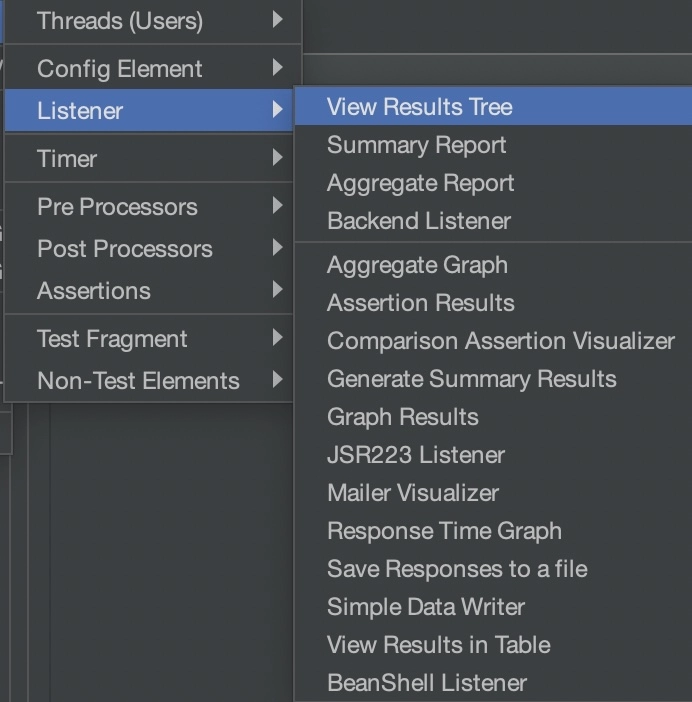
The steps to add a listener are as follows test plan or thread group is
-> Add -> listeners -> required listener.
Various Listeners in JMeter
JMeter offers many listeners. However, the most popular ones are table, tree, and graph. Some others are:
View Results Tree
Summary Report
Aggregate Report
Backend Listener
Aggregate Graph
Assertion Results
Comparison Assertion Visualizer
Generate Summary Results
Graph Results
JSR223 Listener
Mailer Visualizer
Response Time Graph
Save Responses to a file
Simple Data Writer
View Results in Table
Bean Shell Listener
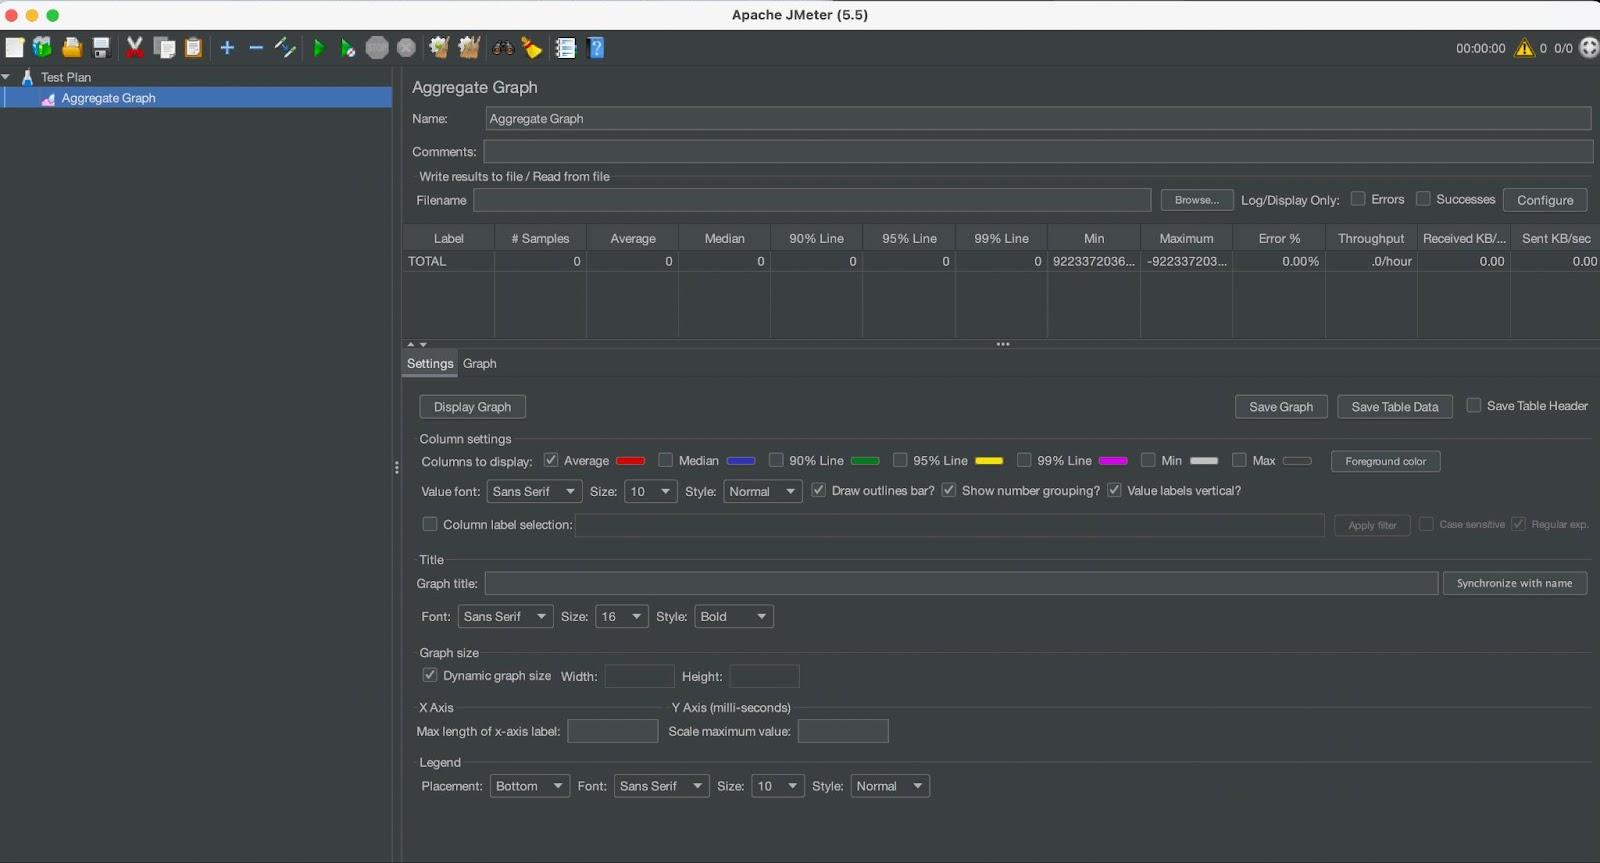
Aggregate Graph
The result obtained is generally a bar graph using an aggregate graph listener. These graphs can be customized by changing the options and choosing the graph visualization.
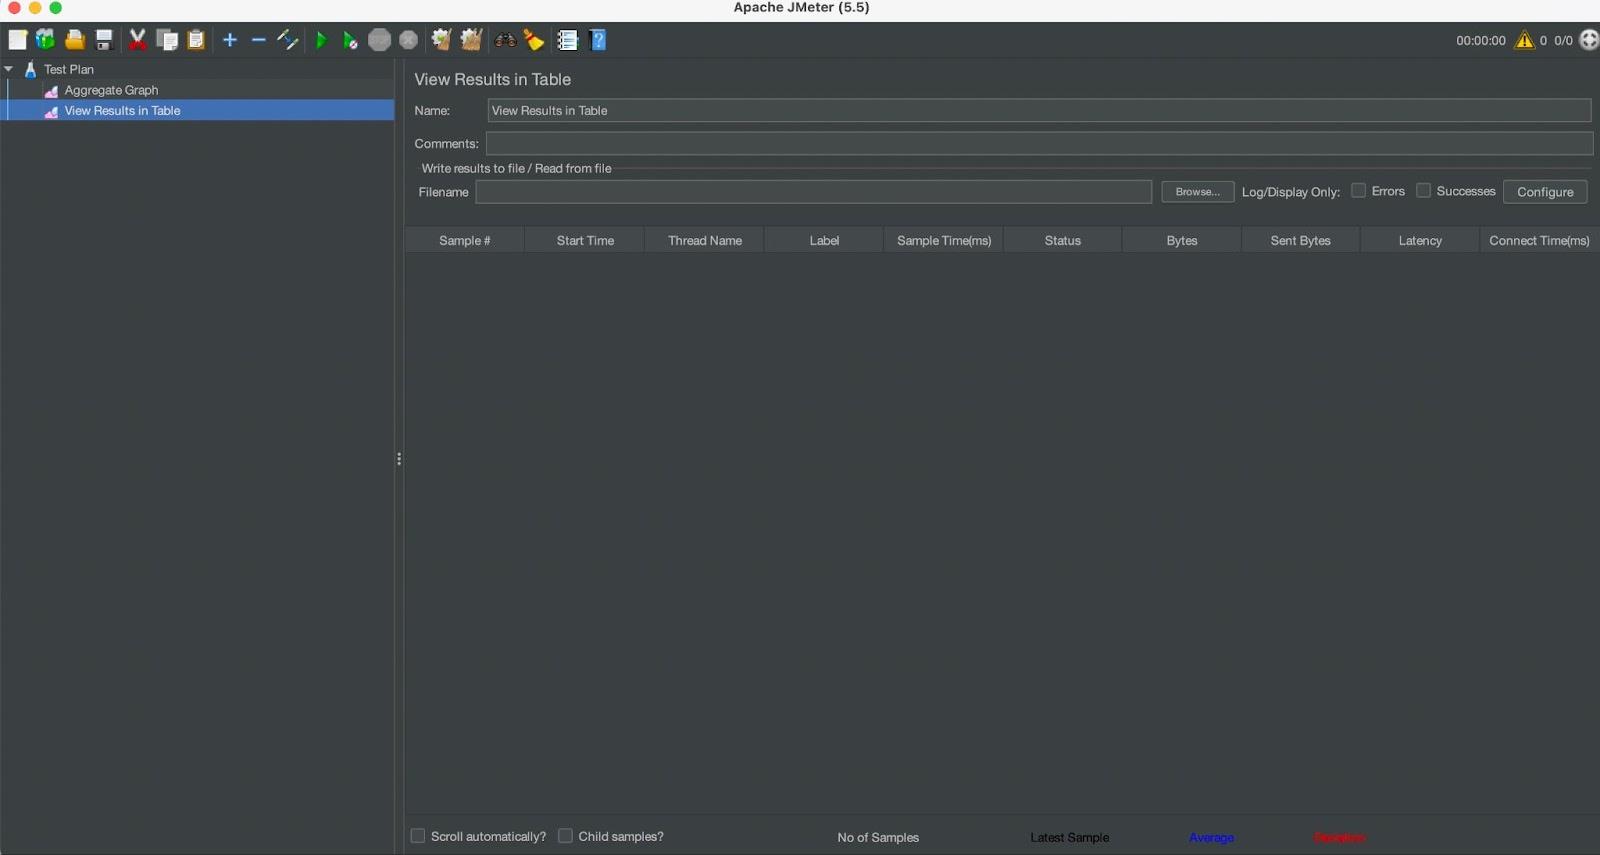
View Results in Table
The results can be stored in a table format. Each user request creates a new row.
It can be used to run a functional test.
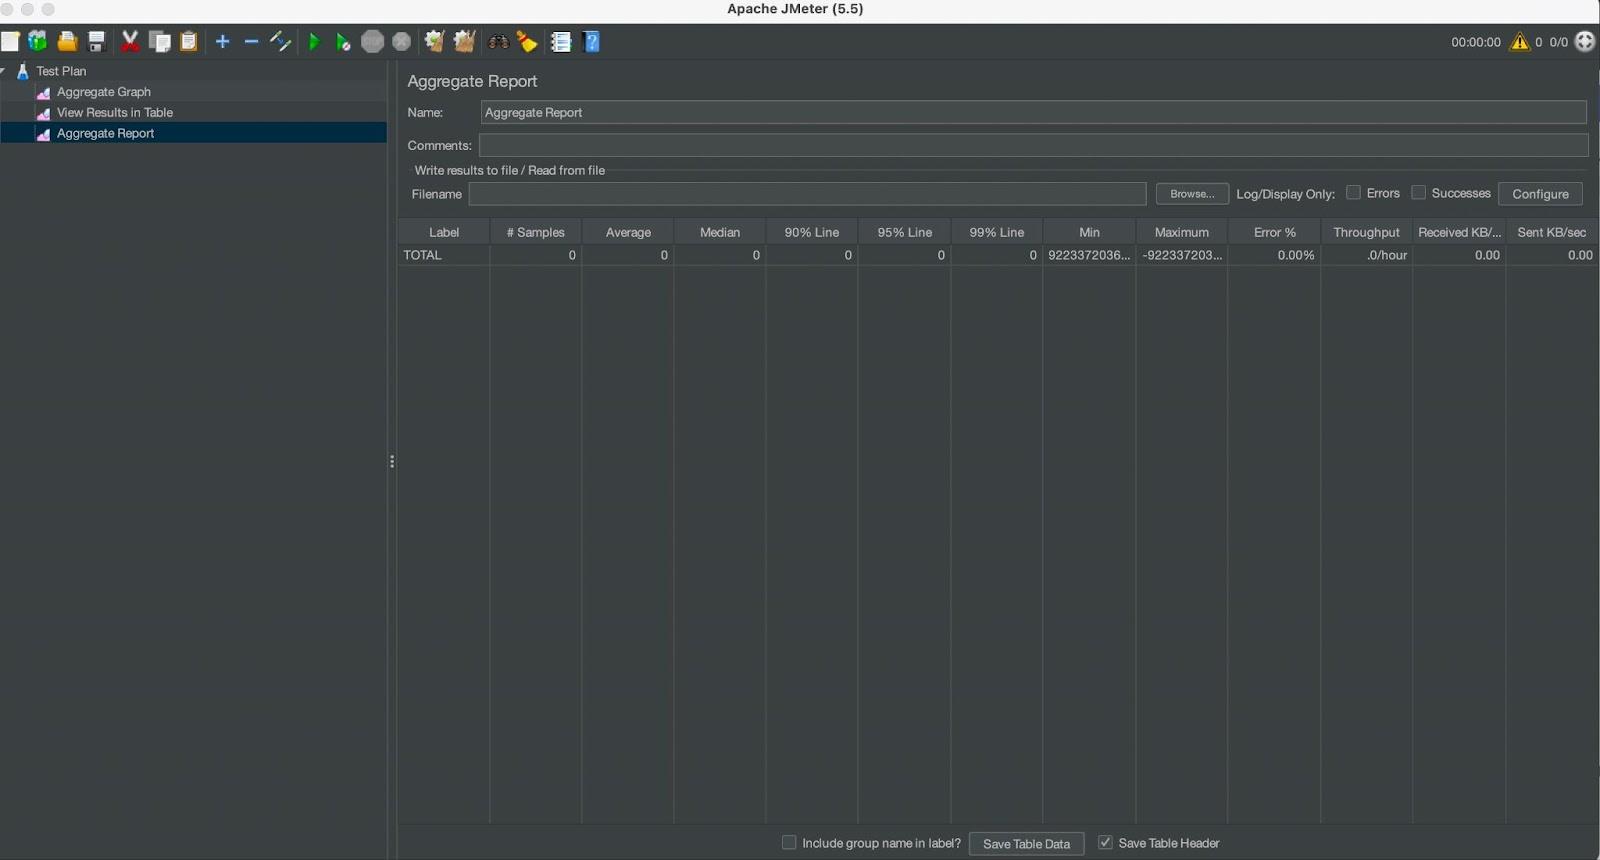
Aggregate Report
The aggregate report listener generates results as a table. Each user request creates a new row.
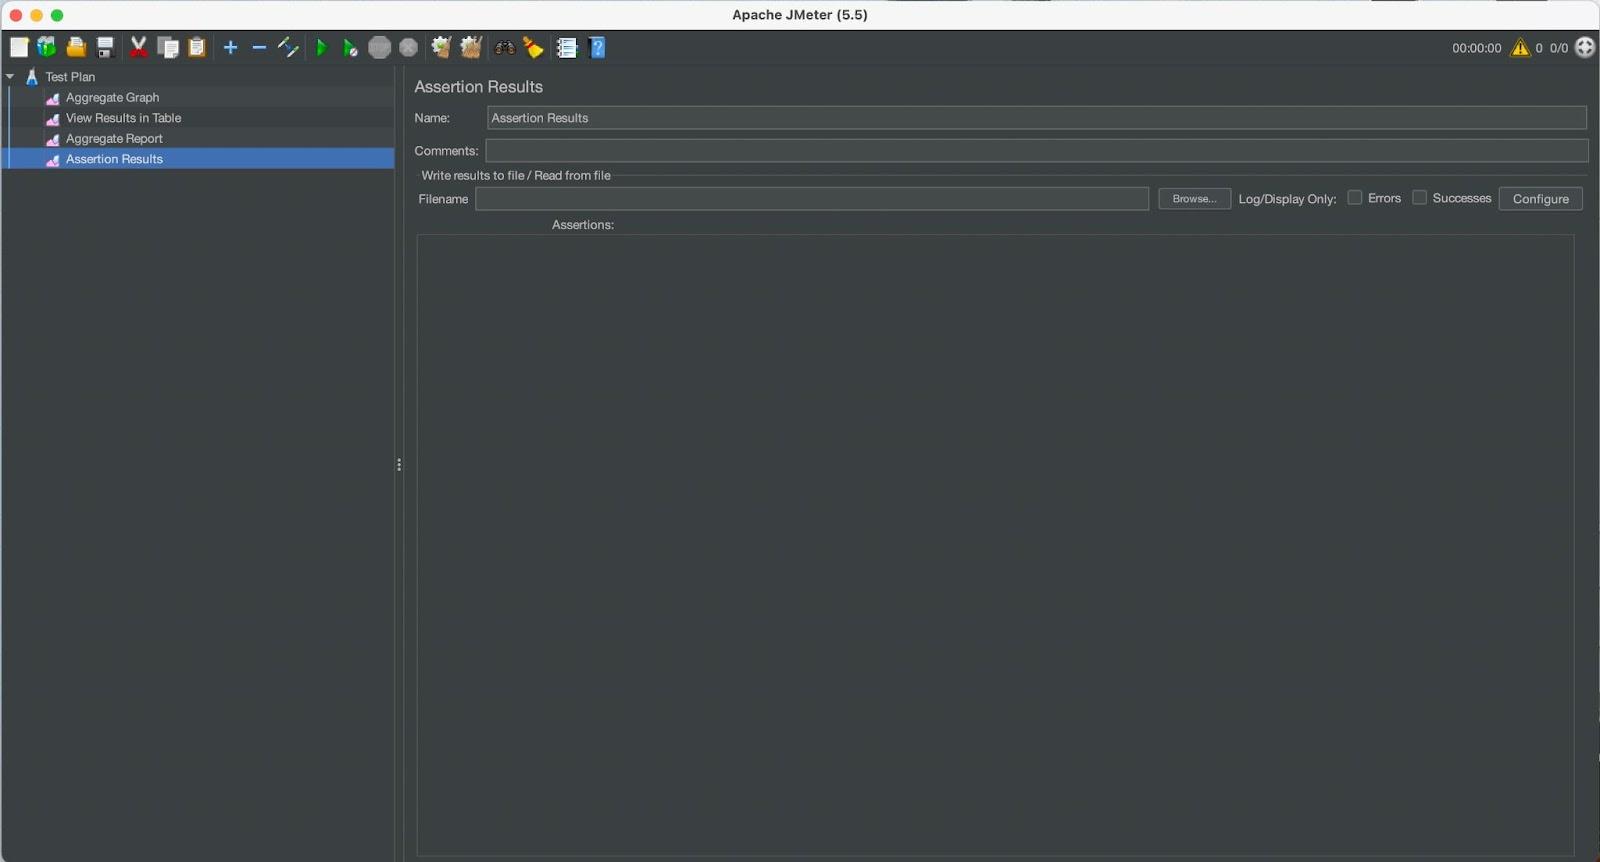
Assertion Results
This listener function can validate the outcomes of the assertions added to the test plan. Success or failure will be displayed here.
With an emphasis on online applications, Apache JMeter is an Apache project that may be used as a load-testing tool for evaluating and monitoring the performance of several services.
Describe the JMeter listener.
A listener is a component that displays the samples' results. The test's listeners can be changed at any point, even under the test plan.
In JMeter test, where do we add listeners?
To the test plan: -> Add -> listeners -> required listener.
Which JMeter listeners show the server status?
The Spline Visualizer is the JMeter listener that shows the server status.
In which listener is the server status displayed?
Test results status is displayed using JMeter Listeners.
Conclusion
In this blog, we have discussed an introduction to JMeter listeners along with short descriptions of commonly used listeners.
If you think this blog has helped you enhance your knowledge about the above question, and if you want to learn more, check out our articles. Visit our website to read more such blogs.
But suppose you have just started your learning process and are looking for questions from tech giants like Amazon, Microsoft, Uber, etc. In that case, you must look at the problems, interview experiences, and interview bundles for placement preparations. Enroll in our courses and refer to the mock test and problems available; look at the Problem Sheets, interview experiences, and interview bundle for placement preparations. You can also book an interview session with us.
However, you may consider our paid courses to give your career an edge over others!
Live masterclass
Amazon Data Analyst Roadmap – From Resume to Interview
by Abhishek Soni
08 Jul, 2026
12:30 PM
Zero to GenAI Developer: Amazon SDE Roadmap for 30L+ CTC
by Sumit Shukla
07 Jul, 2026
12:30 PM
Interview-Ready RAG Project Walkthrough by Google SWE3
by Saurav Prateek
09 Jul, 2026
11:30 AM
Amazon-Ready Excel & AI Skills: Ace 20L+ Data Analyst Roles
by Prerita Agarwal
06 Jul, 2026
11:30 AM
Amazon Data Analyst Roadmap – From Resume to Interview
by Abhishek Soni
08 Jul, 2026
12:30 PM
Zero to GenAI Developer: Amazon SDE Roadmap for 30L+ CTC


 18+ registered

