Getting started with Matplotlib
Installation
pip install matplotlib

You can also try this code with Online Python Compiler
Importing Matplotlib
from matplotlib import pyplot as plt
""" or """
import matplotlib.pyplot as plt

You can also try this code with Online Python Compiler
Common plots in Matplotlib
# values of x-axis
x = [7, 3, 9, 5, 8]
# values of y-axis
y = [8, 4, 6, 3, 1]

You can also try this code with Online Python Compiler
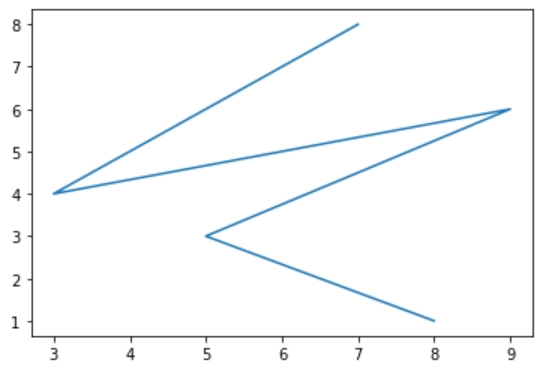
Line plot
# Plotting Function
plt.plot(x, y)

# display the plot
plt.show()

You can also try this code with Online Python Compiler
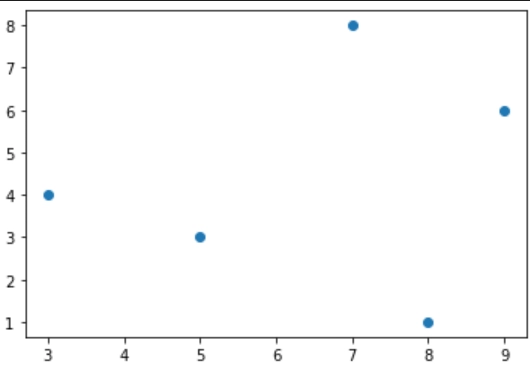
Scatter plot
# Plotting Function
plt.scatter(x, y)

# display the plot
plt.show()

You can also try this code with Online Python Compiler
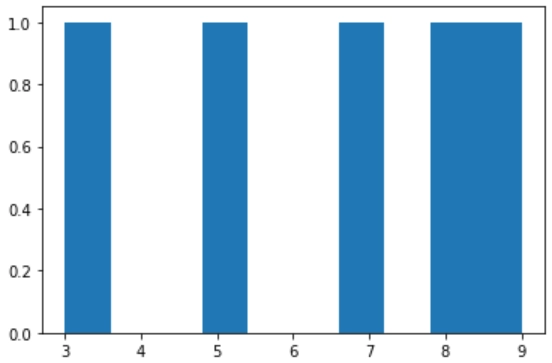
Histogram plot
# Plotting Function
plt.hist(x)

# display the plot
plt.show()

You can also try this code with Online Python Compiler
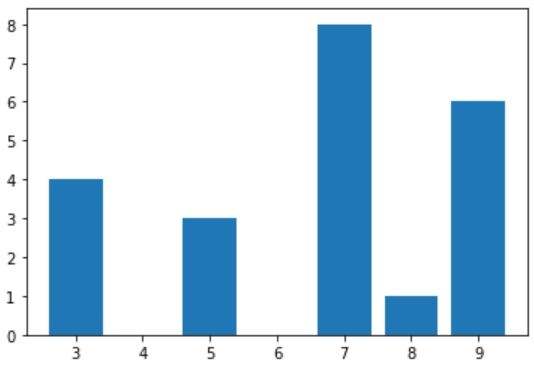
Bar plot
# Plotting Function
plt.bar(x, y)

# display the plot
plt.show()

You can also try this code with Online Python Compiler
Seaborn
Seaborn is an excellent Python visualization tool for plotting statistical visuals. It is based on the matplotlib software and is tightly connected with pandas data structures.
The goal of Seaborn is to make visualization a core aspect of data exploration and understanding. It offers dataset-oriented APIs, allowing us to move between several visual representations for the same variables to comprehend the data better.
Getting started with Seaborn
Installation
pip install Seaborn

You can also try this code with Online Python Compiler
Importing Seaborn
import numpy as np

import seaborn as sns

You can also try this code with Online Python Compiler
Common plots in Seaborn
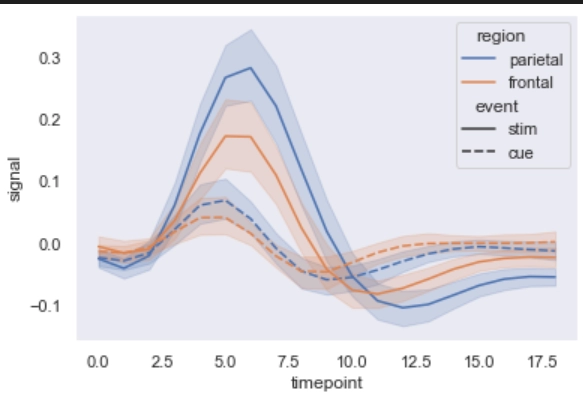
Line plot
sns.set(style='dark')

# getting the dataset
fmri = sns.load_dataset('fmri')

# Plotting for different events regions
sns.lineplot(x='timepoint', y='signal', hue='region', style='event', data=fmri)

You can also try this code with Online Python Compiler
Lmplot plot
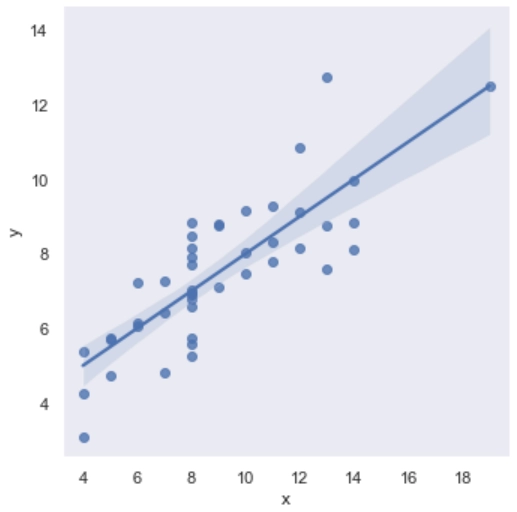
sns.set(style='dark')

# getting the dataset
data = sns.load_dataset('anscombe')

# plotting the results
sns.lmplot(x='x', y='y', data=data)

You can also try this code with Online Python Compiler
Dist plot
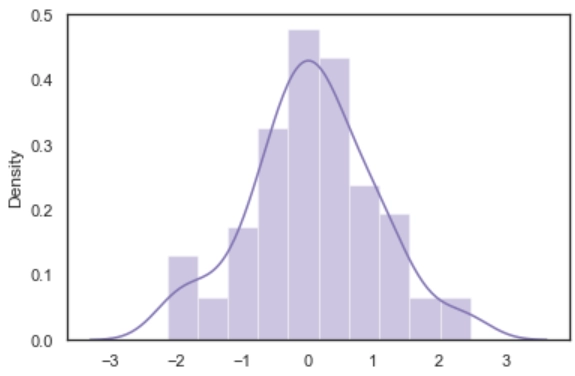
# chosing style as white (other options - dark, whitegrid, darkgrid and ticks)
sns.set(style='white')

# generate a random dataset
data = np.random.RandomState(10)
ndata = data.normal(size=100)

# Plotting a histogram
sns.distplot(ndata, kde=True, color='m')

You can also try this code with Online Python Compiler
Seaborn vs Matplotlib
-
Functionality
- Seaborn: Seaborn has many visualization patterns to choose from. It employs less syntax and comes with several visually appealing default themes. It specializes in statistics visualization and is used when a user needs to summarise data in a visualization while simultaneously displaying the data's distribution.
- Matplotlib: Matplotlib is primarily used for simple plotting. Bars, pies, lines, scatter plots, and other visualizations using Matplotlib are standard.
-
Managing multiple figures
- Seaborn: The generation of several figures is automated by Seaborn. It can cause OOM (out of memory) problems.
- Matplotlib: In matplotlib, we can open multiple figures, but every figure must be closed explicitly.
-
Data frames and Arrays
- Seaborn: Seaborn is considerably more intuitive than Matplotlib because it works with the entire dataset. Replot() is the entry API for Seaborn, with the 'kind' parameter allowing you to define the type of plot, which can be line, bar, or any of the other options. Seaborn is not stateful. Therefore, passing an object is required in plot().
- Matplotlib: Matplotlib works with arrays and data frames. For plotting, it has a variety of stateful APIs. Because the object represents the figures and aces, plot() calls without parameters work, eliminating the need to manage parameters.
-
Flexibility
- Seaborn: Seaborn reduces repetition by providing commonly used default themes.
- Matplotlib: Matplotlib is a flexible and powerful plotting library.
FAQs
-
What are the different categories of plot in Seaborn?
Seaborn has several categories of plots, such as Relational Plots, Categorical Plots, Regression Plots, etc.
- How to open and display images using matplotlib?
# importing required libraries
import matplotlib.pyplot as plt
import matplotlib.image as img

# reading the image
testImage = img.imread('g4g.png')

# displaying the image
plt.imshow(testImage)

You can also try this code with Online Python Compiler
Key Takeaways
Cheers if you reached here!! In this blog, we used a random dataset to understand how the K-Means clustering algorithm works.
Check out this problem - Largest Rectangle in Histogram
Yet learning never stops, and there is a lot more to learn. Happy Learning!!


