Features and Uses of Tableau
Let us now look at some features and uses of Tableau.
-
It helps in data exploration and discovery from it so that important and right decisions can be made based on the data represented.
-
No knowledge of any programming language or coding is required to use Tableau. Visuals can be made without this knowledge.
-
It enables the user to connect to other data sources that some Business Intelligence tools do not support. Using Tableau, users can make reports by joining different datasets.
-
Tableau provides an informative dashboard. Dashboards provide data in the form of stories, and they offer a variety of layouts and filters.
-
Tableau provides connectivity from live data sources. It helps in consuming live data from different sources.
-
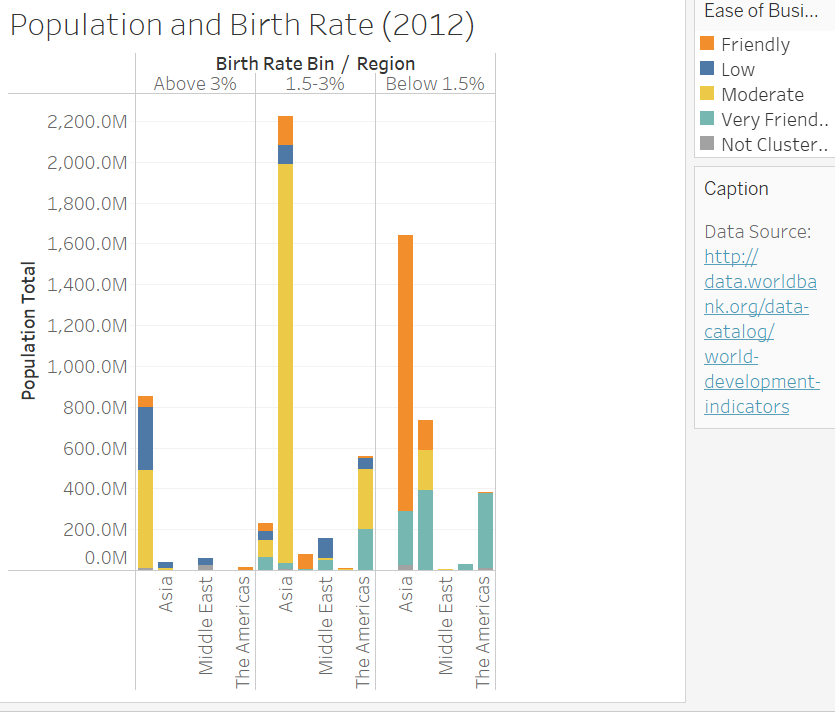
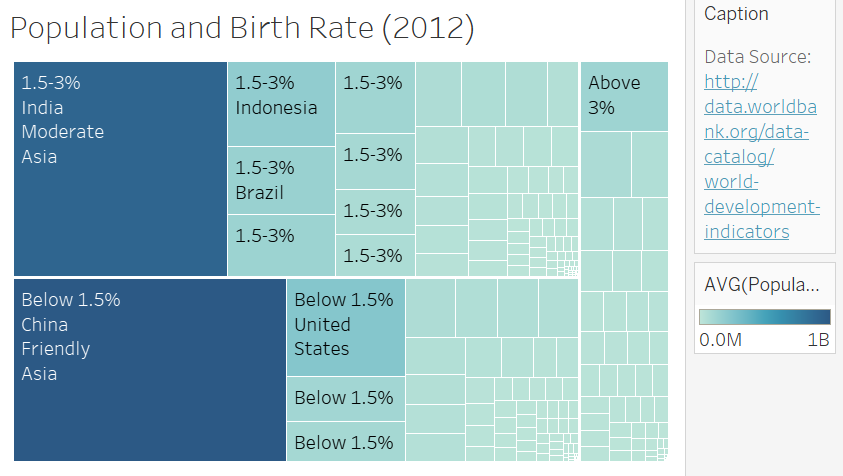
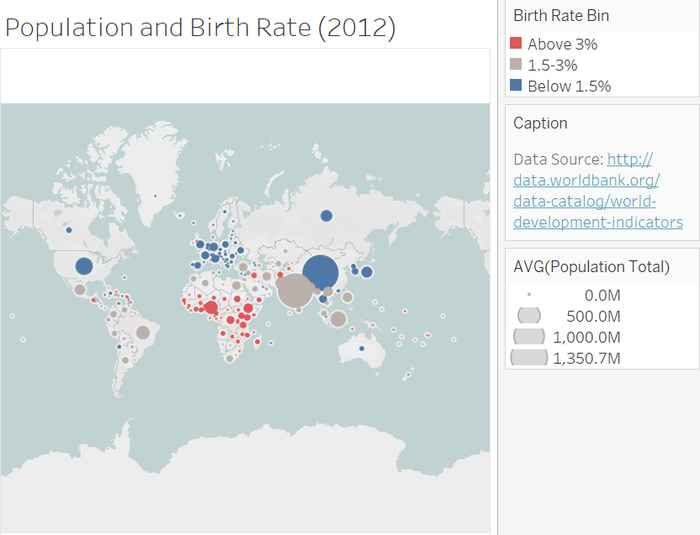
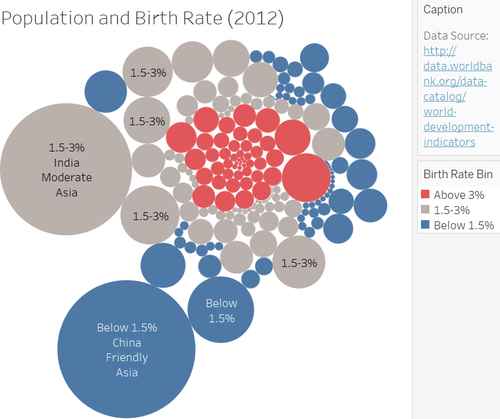
It provides various visualizations, from simple bar graphs or pie charts to motion charts, treemaps, etc.
-
It provides predictive analysis. It uses time series forecasting to create trend lines.
-
It provides options to collaborate with other users. Users can share their data in graphs, charts, or other visualizations in real-time with each other.
- Tableau provides a mobile version of the application. It allows users to create their dashboards according to a mobile device. You can edit your phone layouts and filters. It provides flexibility.
Applications of Tableau
The following are the applications of Tableau:
-
It is used for enhanced visualization of data. It helps users create complex graphs or visuals in a short time.
-
It is used for its wide range of resources: guides, training, forums, etc.
-
It is easy to learn and use. It does not require any prerequisites of programming. It just requires an analytical mind.
- It helps make business decisions based on the data insights gathered from the visualizations.
Advantages of Tableau
Let us look at the main advantages of Tableau.
-
It offers quick analysis than other BI tools. It offers robust computation and provides correct insights into the information.
-
The Dashboard it provides is very interactive. Also, it can be drawn quickly.
-
Tableau can handle large amounts of data, and that too from different sources. Large amounts of data do not affect its Dashboard’s performance.
-
It provides an option to share your data with others in real-time.
- It provides mobile support to its users. It automatically recognizes the device used and adjusts the reports’ formats accordingly.
Disadvantages of Tableau
There are some drawbacks of Tableau too as follows:
-
Tableau has paid versions for dealing with high computations of data.
-
The parameters of Tableau are single-valued and static. So, the parameters are to be changed manually each time the data changes.
-
Since it is a visualization tool, it allows only primary data pre-processing. It consists of the joining and blending of data.
- Automatic scheduling of data is not supported in Tableau. Thus, if a user needs to update the data in the backend, it is to be done manually.
Products Offered by Tableau
There are various products that Tableau offers. These are:
-
Tableau Cloud
It allows users to build interactive visualizations and dashboards from anywhere in the world using cloud services.
-
Tableau Desktop
It is a data visualization software for your personal systems. It helps you make visuals to represent your data in a short time.
-
Tableau Server
It is an online platform allowing users to manage their data sources, reports, workbooks, and dashboards made on Tableau Desktop.
-
Tableau Prep
It allows the users to easily prepare their data, like shaping, cleaning, and combining it for analysis. Also, it helps deliver true data analysis to help the users understand the data they use.
Frequently Asked Questions
What is Tableau?
Tableau is a tool for data analysis and visualization. Without coding, it enables users to make interactive visualizations of their data. It helps in visualizing the data in a short period. Also, it helps get insights from the data and helps in making business decisions.
Is Tableau free or paid?
Tableau Desktop, Tableau Server, and Tableau Online are paid. Tableau Public, Tableau Reader, and Tableau Mobile are free.
How is Tableau different from MS Excel?
MS Excel uses spreadsheets for statistical data analysis and various operations on it. Tableau, on the other hand, is a data visualization tool. It makes interactive visuals, finds trends, and helps drive business decisions.
Is it easy to learn Tableau?
Tableau is an easy-to-learn data visualization and analysis tool. With enough practice, it can be mastered and used in a better way than before. But to master it completely, it may take some more time than the average duration.
Does Tableau require coding?
No, Tableau does not require coding. No knowledge of programming language is required to use Tableau. You only need to have an analytical understanding of the data to master it.
Conclusion
Tableau is a great tool for data visualization. This article studied its uses, features, pros, and cons. We also looked at some of its visualizations in terms of different charts and graphs.
If you are interested in Tableau and want to learn more, do read the following:
To learn more about DSA, competitive coding, and many more knowledgeable topics, please look into the guided paths on Coding Ninjas Studio. Also, you can enroll in our courses and check out the mock test and problems available. Please check out our interview experiences and interview bundle for placement preparations.
Happy Coding!


 8+ registered

