Do you think IIT Guwahati certified course can help you in your career?
Introduction
Hello Ninja, I hope you are doing great. Do you know Tooltips in Tableau? If not, don't worry. We are here to enrich your knowledge and clear all your doubts. Sometimes it becomes difficult to understand some data point of a visualised data. To overcome this issue, Tableau provides us with a Tooltip, which gives the additional context of the data point and some documentation links related to the data. In this article we will discuss Introduction to Tooltips in Tableau.
This article will discuss the topic of Introduction to Tooltips in Tableau. We will thoroughly cover all its features, applications, and implementations of its effective methods.
What is Tableau?
Tableau is a data visualization and business intelligence tool widely used by Data Analysts and professionals from various fields. It excels in quickly processing input data and providing meaningful visualization outputs. Tableau can connect to multiple data sources, including databases and cloud services, which allow us to combine data from numerous sources for detailed analysis. It offers a wide range of visualizations, including charts, tables, and maps, to represent the data meaningfully.
What is Tooltip in Tableau?
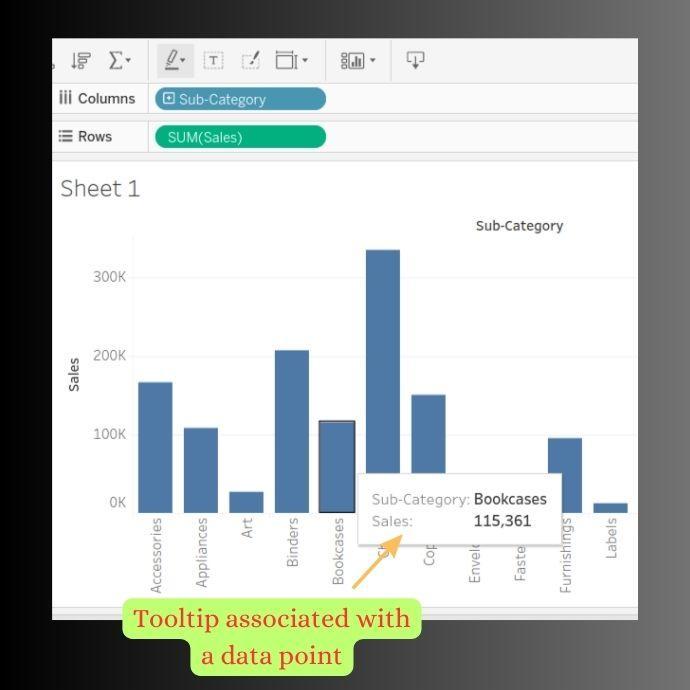
Tooltip is a powerful tool that helps us to understand the values and the numbers associated with a particular visualization. It offers supplementary information related to the data point. This information includes values, labels, or relevant data that help us analyze the graph. Whenever we hover our mouse pointer over a specific data point, it gives a tooltip associated with that visualized data. We can customize a tooltip and add various elements, such as Measures, text, calculations, and many more. The image below shows the Tooltip associated with a data point having a "Bookcases" sub-category. Here the "Sub-category" is a dimension, and "Sales" is a Measure. When we hover over the "BookCases," it gives a Tooltip associated with it.
Features of Tooltips in Tableau
Features
Description
Display Details
Tooltip allows us to display information about the individual data points. The information may include values, Dimensions, Measures, and calculated Fields.
Customization
Tooltips allow us to customize their data by rearranging the order of data, changing the font style, and changing the colour of the text.
Insert Images
Tableau allows us to insert images or icons in Tooltips. This provides additional visual content to enhance understanding.
Insert Hyperlinks
We can insert Hyperlinks in our Tooltip, allowing users to access external resources related to the visual data.
Data Relationships
When we hover over a data point in a visualization, the corresponding data point in another related visualization can be highlighted.
Customized Interaction and Appearance
We can control the Tooltip interaction by specifying their duration whether they remain visible and setting the delay before they appear.
Adding Calculated Fields
We can add Calculated Fields in a Tooltip to perform some calculations including aggregations and mathematical operations to find a unique property of our data.
Implementing various Tooltip Methods in Tableau
Insert Extra Fields in Tooltip
Inserting fields in the Tooltip allows us to display relevant data when we hover over the specific data point. This helps us to understand the underlying data by providing supplementary information.
Let’s see an example to understand how to insert the fields in the Tooltip.
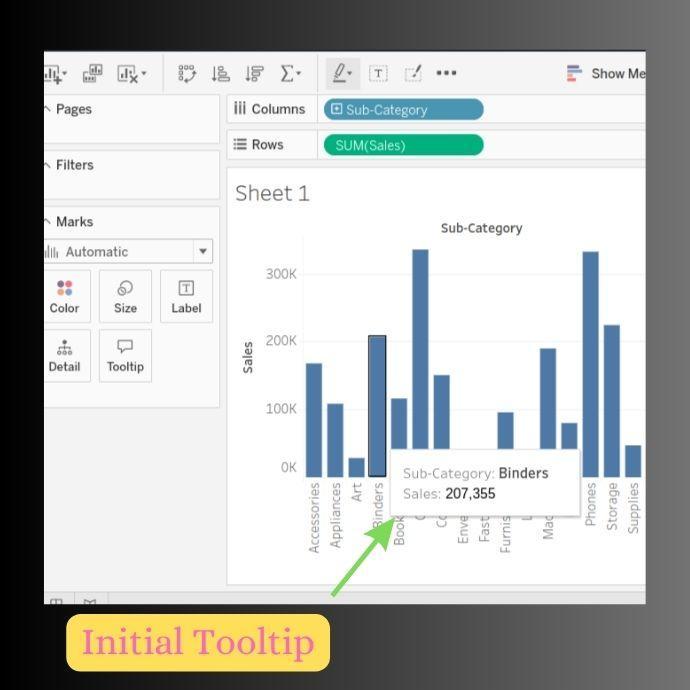
Step 1: The image below shows the bar graph having “Sub-Category” Dimension and “Sales” Measure. When we hover over the data point “Blinders” , its Tooltip gives the information about its “Sub-category” and “Sales”.
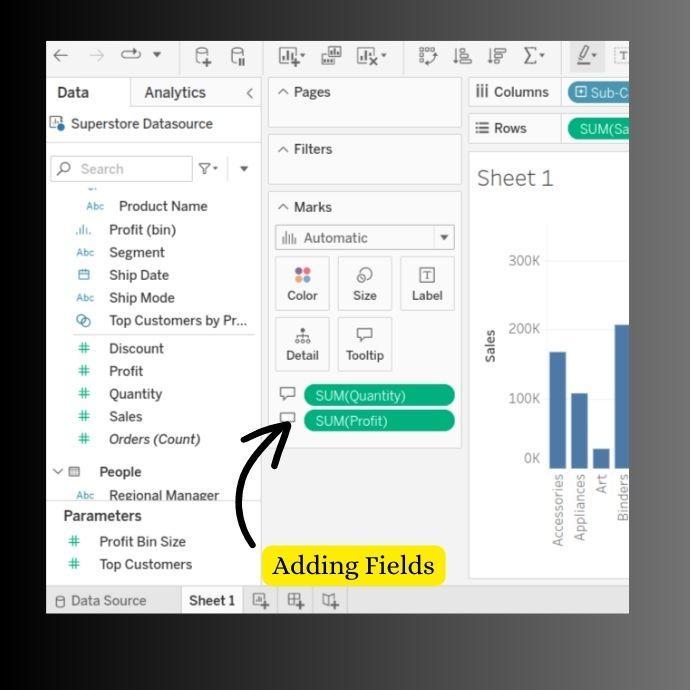
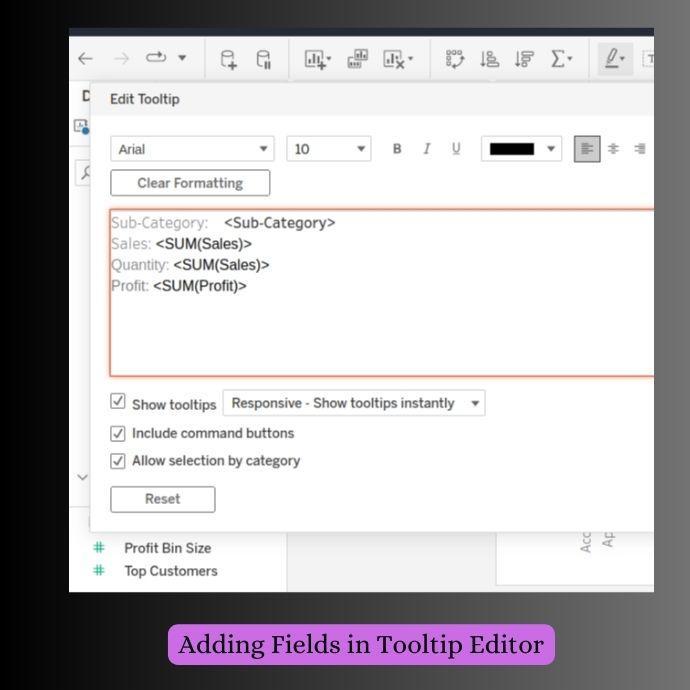
Step 2: our next step is to add fields in the Tooltip mark. Here we are adding “Quantity" and “Profit” Measures.
Step 3: Now, edit the information in the Tooltip Editor. You can open this Editor by double clicking on the Tooltip icon. As we are adding Measures, so use appropriate aggregate functions. Here we are using the “SUM” function.
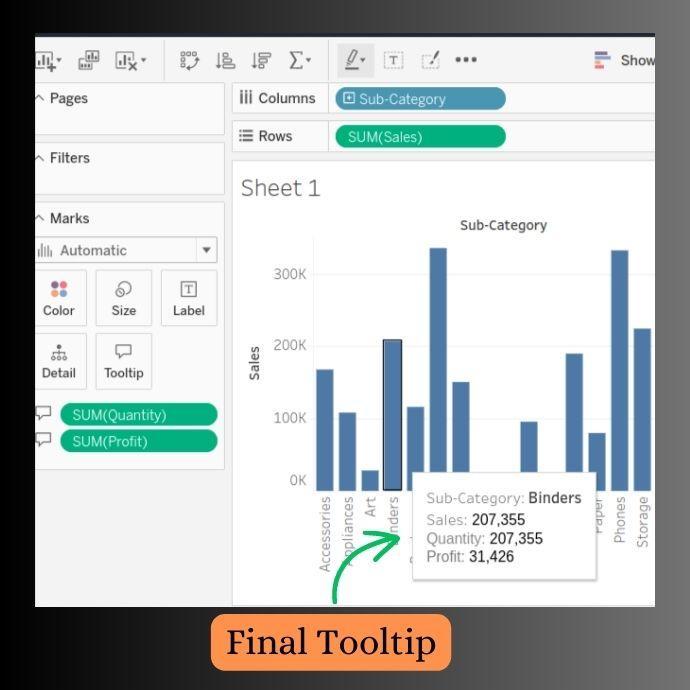
Step 4: The image below shows the final Tooltip having “Quantity” and “Profit” as the newly added fields.
Add Calculated Fields in Tooltip
Adding calculated fields provides a way to calculate and display the results within the Tooltips. We can set a reference point for some data and show the difference between the data point and the reference point in the Tooltip. This helps us explain how close the data point is to the target point.
Let’s see an example to learn how to add these Calculated Fields in the Tooltip.
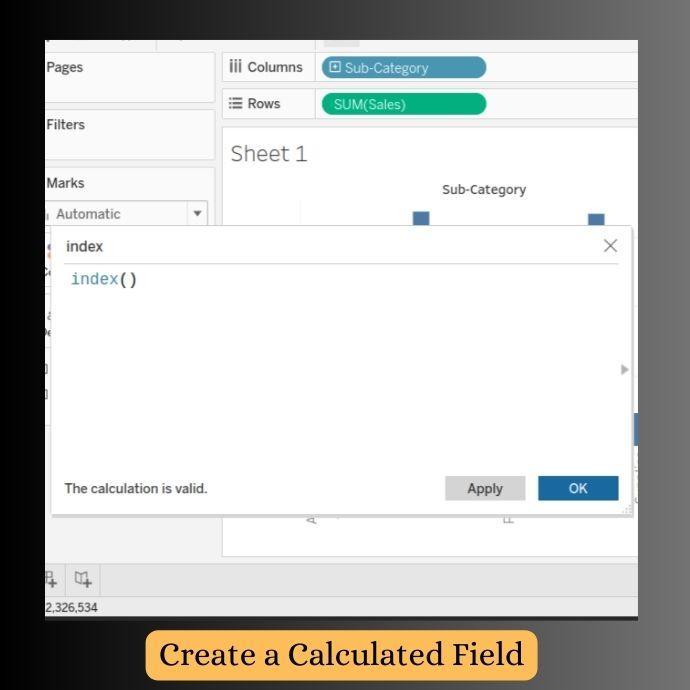
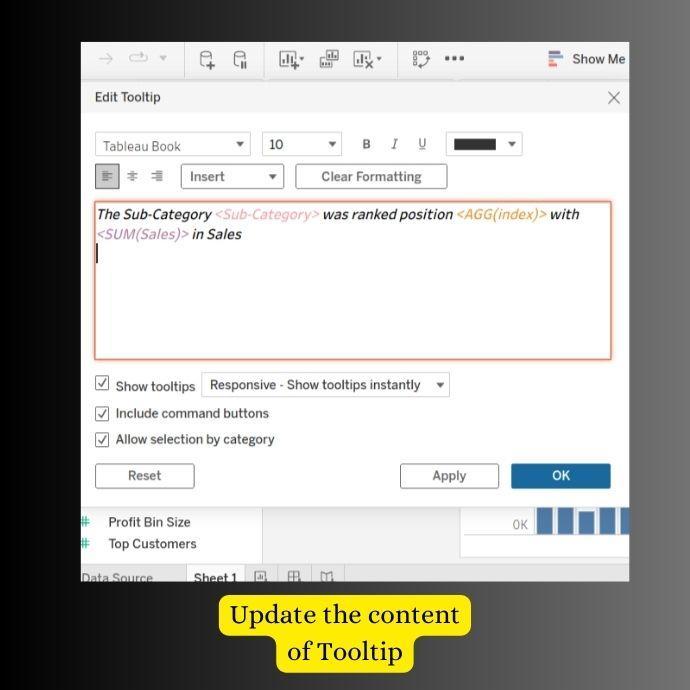
Step 1:We create a calculated field "index" to rank our data points based on the "Sales" Measure. To do this, we use the "index()" function that considers the sorted order of the data and assigns the sequential index to these data points based on their order.
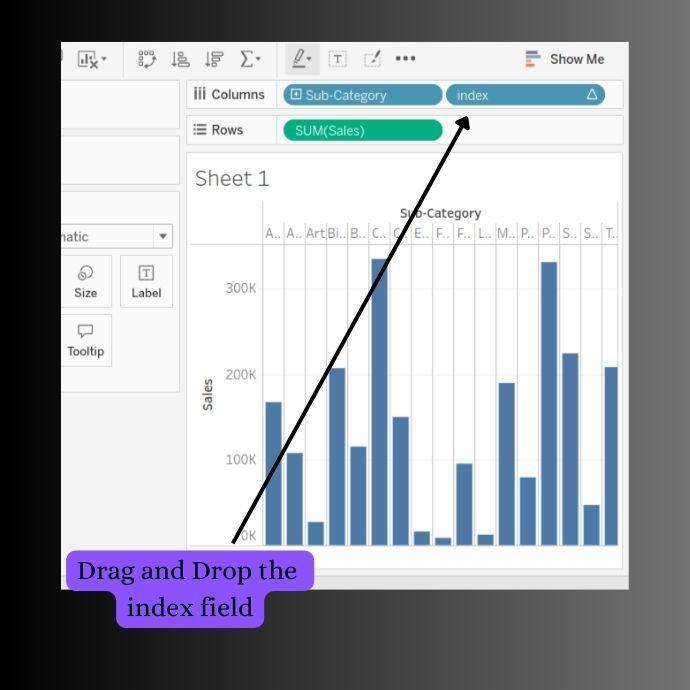
Step 2:Drag the "index" field and drop it into the columns. This field will do some calculations on the data points and give ranks to each of them.
Step 3: Update the content in the Tooltip Editor. Show the ranks to each of the data points in the tooltip.
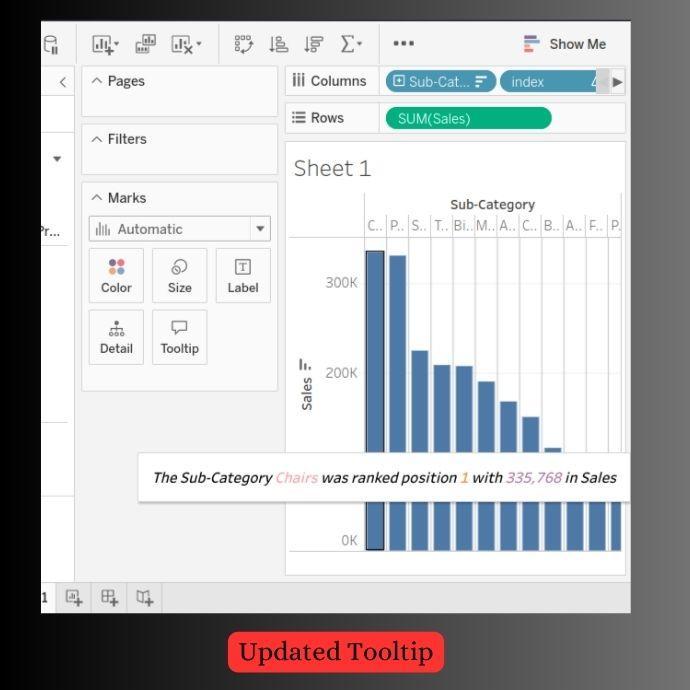
Step 4: Now, you can see, the Toolbar shows the ranks of each of the data points.
Add Hyperlinks in Tooltip
Adding Hyperlinks allows us to provide links within the Tooltip. These links contain references and external information relevant to our data. This helps us to gather more comprehensive information and enables us to verify the reliability of the data.
Let’s see how to add these Hyperlinks in the Tooltip.
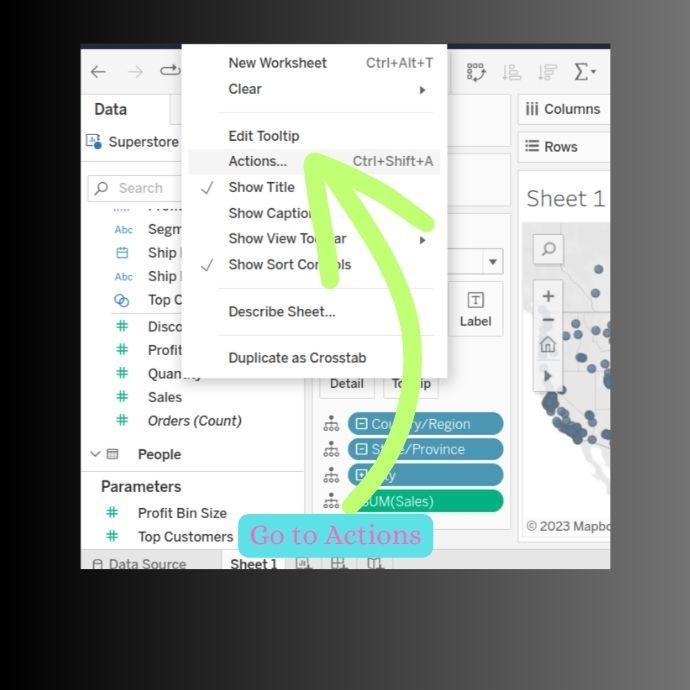
Step 1: click on the “Worksheet” and go to the “Actions” or you can also press “ctrl+shift+A”.
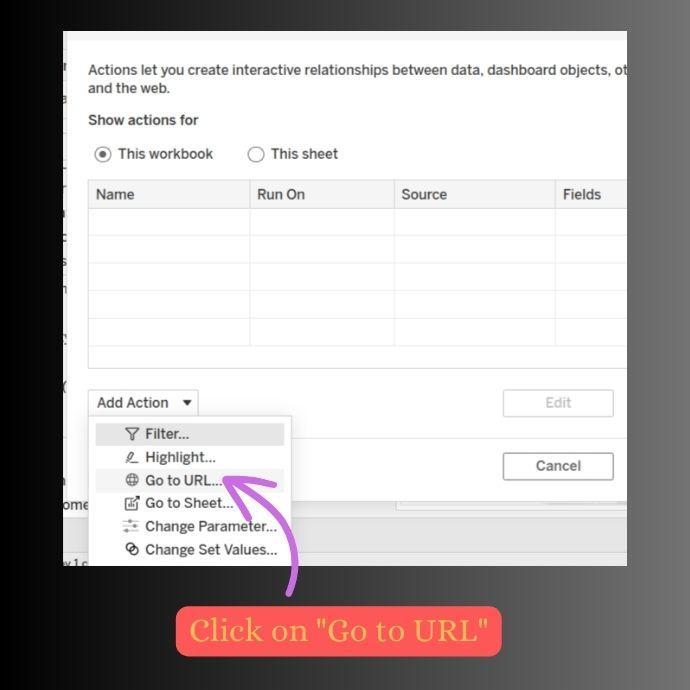
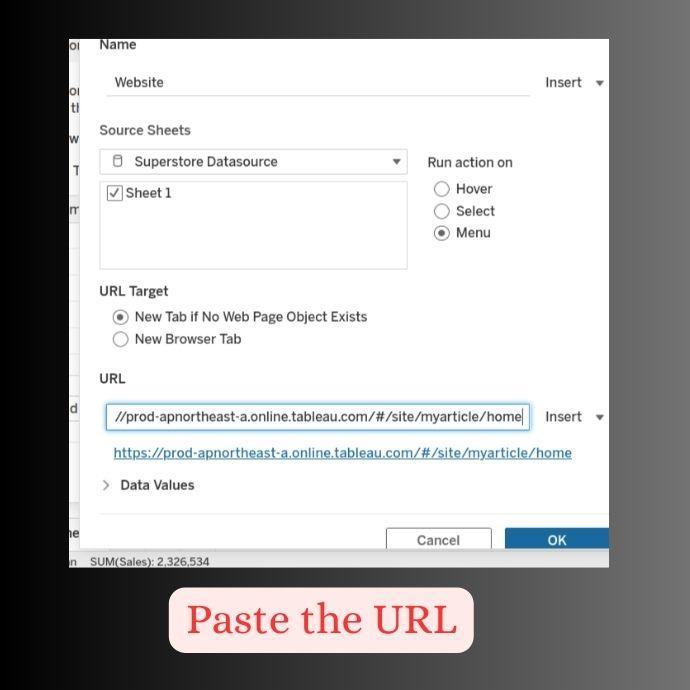
Step 2: Now click “Go to the URL” to add a link to our action and give it a name.
Step 3: Give a name to the action and paste the URL you want to show in the Tooltip. The image below shows the options that need to be chosen.
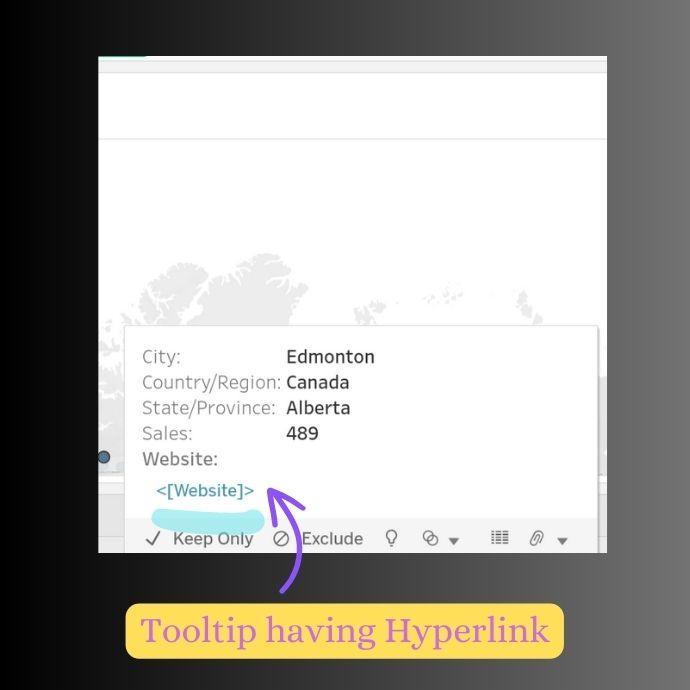
Step 4: Now you can see, our final Tooltip contains a Hyperlink. By clicking this link, the control goes to the page linked with this Hyperlink.
Applications of Tooltips in Tableau
Tooltips act as data quality indicators and can be used for data validation that helps users identify faults and correct inconsistencies.
They act as Data Callouts that include additional comments and highlight essential information making it easier for others to interpret the data.
Tooltips can include some buttons for calculation purposes. We can click those buttons and see the calculated results without leaving the dashboard.
We can quickly analyze the network diagrams by clicking on the hyperlinks provided by Tooltip. Those hyperlinks contain detailed documentation of the network.
It acts as the performance indicator, enabling data comparison by showing relevant information from multiple sources.
Frequently Asked Questions
Are Tooltips customizable in Tableau?
Yes, Tooltips are customizable in Tableau. It allows us to change the text's font, size, alignment, and colour. We can also control what information is displayed and how users interact.
What is the purpose of using Tooltips in Tableau?
The purpose of using Tooltip in Tableau is to provide additional information to the data points of the visualization. It offers detailed information, Hyperlinks, Images, and calculations, enabling users to understand the data effectively.
What are the benefits of using Hyperlinks within Tooltips?
The Hyperlinks present in the Tooltips allow us to access external resources and related documentation, within a single click. It enables us to gather more information or insights beyond visualization.


 8+ registered

