Do you think IIT Guwahati certified course can help you in your career?
KNN (K-Nearest Neighbors) and K-Means often lead to confusion due to their seemingly similar nomenclature. However, despite sharing the "K" in their names and being fundamental algorithms in the field, KNN and K-Means serve entirely different purposes and operate on distinct principles.
KNN is a predictive algorithm that makes predictions or classifications for new data based on existing data. Whereas, the K-means algorithm looks for patterns or groups within the data. It helps to organize the data into clusters with similar characteristics without making predictions.
Understanding these differences is crucial for data scientists and machine learning practitioners to apply the right algorithm to the right problem.
What is KNN?
KNN is a supervised machine learning algorithm that is used for classification problems. Since it is a supervised machine learning algorithm, it uses labelled data to make predictions.
KNN analyzes the 'k' nearest data points and then classifies the new data based on the same.
In detail, to label a new point, the KNN algorithm analyzes the ‘k’ nearest neighbors or ‘k’ nearest data points to the new point. It chooses the label of the new point as the one to which the majority of the ‘k’ nearest neighbors belong to.
KNN Algorithm
The various steps involved in KNN are as follows:-
Choose the value of ‘K’ where ‘K’ refers to the number of nearest neighbors of the new data point to be classified.
Now, compute the euclidian distance between the new input (new data point) and all the training data.
Example: Let us assume we have two points, A1(X1, Y1) and B2(X2, Y2). Then the euclidian distance between the two points would be the following:-
Sort these distances in ascending order and choose the first ‘K’ minimum distance values. This will give us the ‘K’ nearest neighbors of the new data point.
Now, find out the label/class to which all these neighbors belong.
Find the majority class these neighbors belong to and assign that particular label to the new input.
Finally, return the predicted class of the new data point.
Note: It is essential to choose an appropriate value of ‘K’ to avoid the overfitting of our model.
Advantages of KNN
Simplicity and Ease of Implementation: KNN is straightforward to understand and implement, making it an excellent choice for beginners in machine learning.
No Training Phase: Unlike many other algorithms, KNN does not require a training phase, which simplifies the process and reduces computation time for model building.
Adaptability to Different Data Distributions: KNN can handle multi-class classification problems and works well with various data distributions without making strong assumptions about the underlying data.
Versatility in Applications: It is widely used in numerous applications, such as recommendation systems, image recognition, and anomaly detection.
Disadvantages of KNN
Computationally Intensive: KNN can be slow and inefficient with large datasets because it requires computing the distance between the query point and all other points in the dataset.
Sensitivity to Irrelevant Features: The performance of KNN can degrade if the dataset contains many irrelevant features, as these can distort distance calculations.
Memory Usage: Since KNN stores all training data, it can require significant memory, especially with large datasets.
Curse of Dimensionality: KNN struggles with high-dimensional data, where the notion of distance becomes less meaningful, leading to poor classification performance
What is K-Means Clustering?
K-Means is an unsupervised machine learning algorithm that is used for clustering problems. Since it is an unsupervised machine learning algorithm, it uses unlabelled data to make predictions.
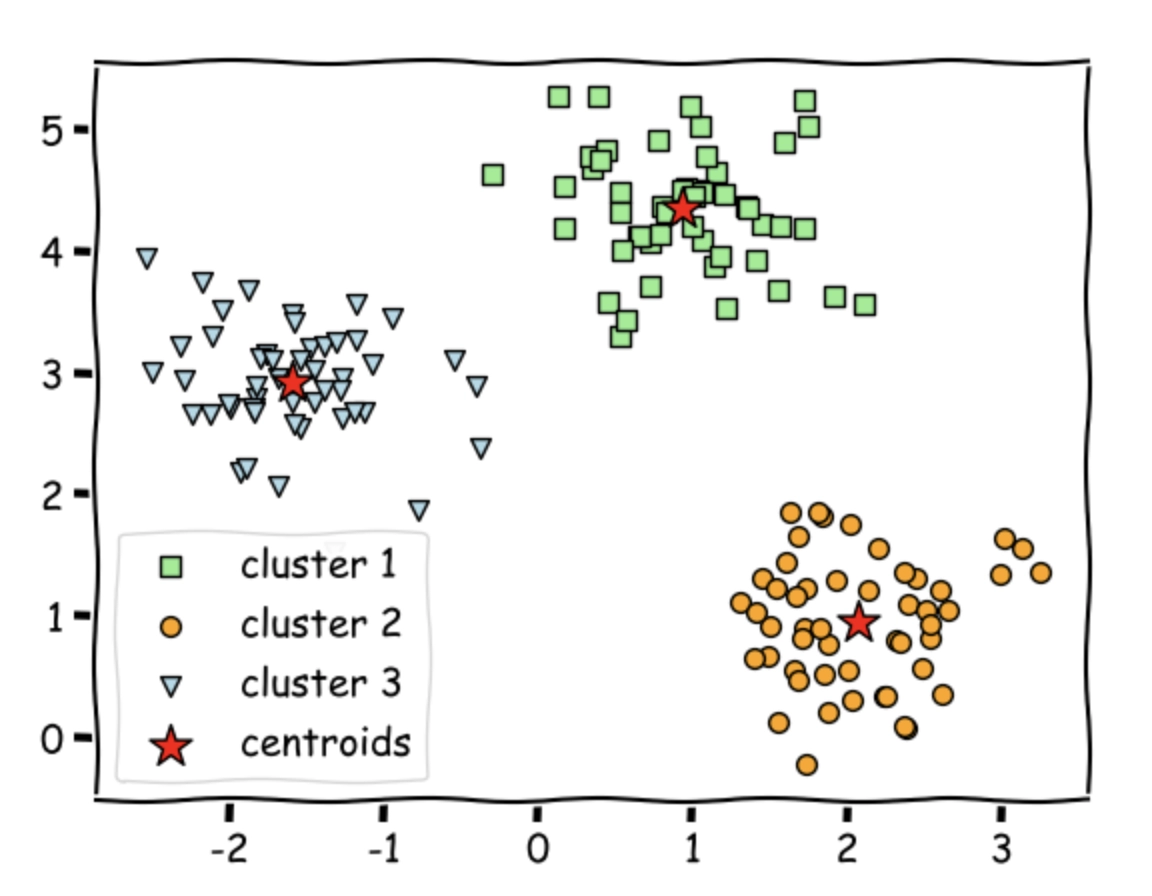
K-Means is nothing but a clustering technique that analyzes the mean distance of the unlabelled data points and then helps to cluster the same into specific groups.
In detail, KNN divides unlabelled data points into specific clusters/groups of points. As a result, each data point belongs to only one cluster that has similar properties.
K-Means Clustering Algorithm
The various steps involved in K-Means are as follows:-
Choose the 'K' value where 'K' refers to the number of clusters or groups.
Randomly initialize 'K' centroids as each cluster will have one center. So, for example, if we have 7 clusters, then we would initialize seven centroids.
Now, compute the euclidian distance of each current data point to all the cluster centers. Based on this, assign each data point to its nearest cluster. This is known as the 'E- Step.'
Example: Let us assume we have two points, A1(X1, Y1) and B2(X2, Y2). Then the euclidian distance between the two points would be the following:-
Now, update the cluster center locations by taking the mean of the data points assigned. This is known as the 'M-Step.'
Repeat the above two steps until convergence, i.e., until we reach a global optimum where no further optimization is possible.
Advantages of K-Means Clustering
Simplicity and Scalability: K-Means is relatively easy to implement and can handle large datasets efficiently.
Speed and Efficiency: The algorithm converges quickly and has a linear time complexity, making it suitable for large-scale applications.
Adaptable to Various Applications: K-Means is versatile and can be used in numerous clustering applications, such as market segmentation, image compression, and anomaly detection.
Interpretability: The resulting clusters from K-Means are often easy to understand and interpret, providing clear insights into the structure of the data.
Disadvantages of K-Means Clustering
Predefined Number of Clusters: K-Means requires specifying the number of clusters (K) beforehand, which can be challenging without prior knowledge of the data.
Sensitivity to Initialization: The final clusters can vary significantly based on the initial placement of centroids, leading to potentially suboptimal solutions.
Assumption of Spherical Clusters: K-Means assumes clusters are spherical and equally sized, which may not always align with the true distribution of data.
Outliers and Noise Sensitivity: The algorithm is sensitive to outliers and noisy data, which can distort the clustering results.
Difference Between KNN and K-Means
Parameter
KNN (K-Nearest Neighbors)
K-Means
Type
Supervised Learning
Unsupervised Learning
Purpose
Classification and Regression
Clustering
Training Phase
None
Requires iterative training
Working Principle
Based on distances to nearest neighbors
Based on minimizing within-cluster variance
Memory Usage
High, stores all training data
Lower, only stores cluster centroids
Computational Cost
High for large datasets
Relatively lower, but depends on number of iterations
Sensitivity
Sensitive to irrelevant features and high-dimensional data
Sensitive to initialization, outliers, and predefined K
For simplicity, we would use the already existing sklearn library for KNN and K-Means implementation.
Importing Necessary Libraries
Firstly, we will load some basic libraries:-
(i) Numpy - for linear algebra.
(ii) Pandas - for data analysis.
(iii) Seaborn - for data visualization.
(iv) Matplotlib - for data visualisation.
(v) KNeighborsClassifier - for using KNN.
(vi) KMeans - for using K-Means.
(vii) classification_report - for generating numerous results.
import numpy as np import pandas as pd import seaborn as sns from matplotlib import pyplot as plt from sklearn.neighbors import KNeighborsClassifier from sklearn.cluster import KMeans from sklearn.preprocessing import LabelEncoder from sklearn.metrics import classification_report from sklearn.metrics import accuracy_score
Loading Data
#loading dataset df= pd.read_csv('iris.csv')
Visualization
We visualize the dataset by printing the first ten rows of the data frame. We use the head() function for the same.
#visualizing dataset df.head(n=10)
Output
#finding different class labels np.unique(df['Species'])
Output
We notice that there are three different classes.
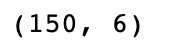
df.shape
Output
The dataset has 150 egs and 6 columns (including one target variable).
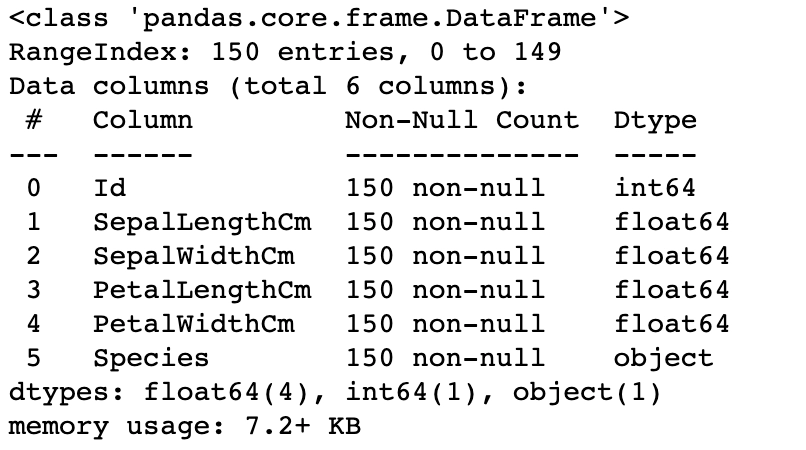
df.info()
Output
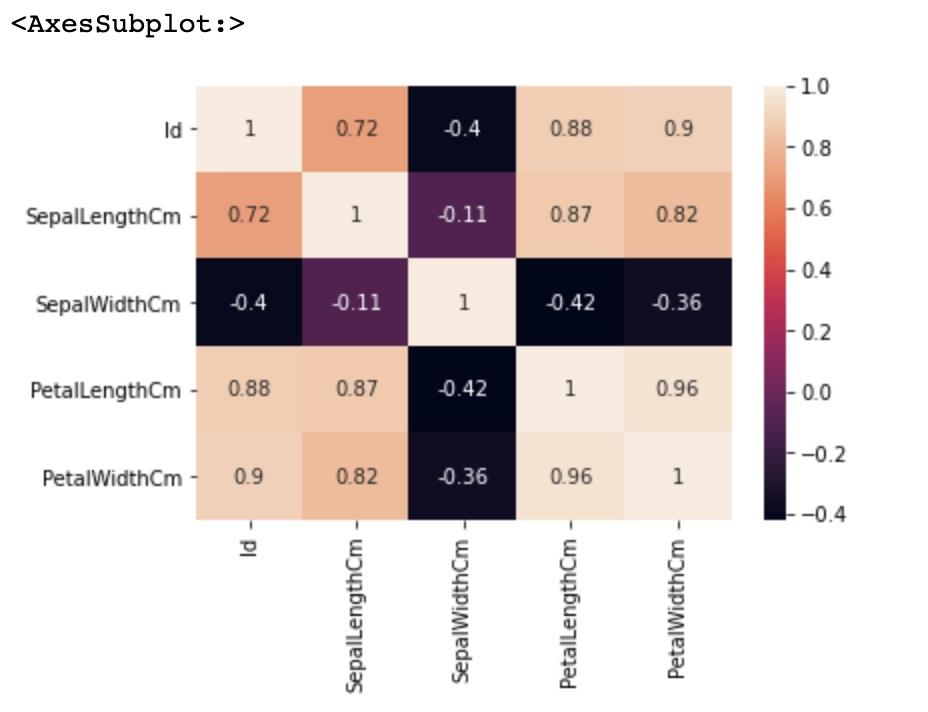
#finding correlation of features correl=df.corr() sns.heatmap(correl,annot=True)
Output
Preprocessing
Data imputation
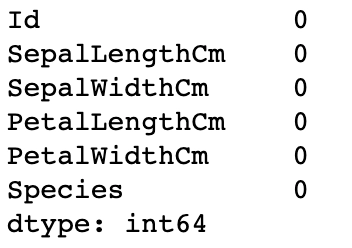
#checking for Null values df.isnull().sum()
Output
We observe that the dataset does not contain any Null values.
Label Encoding
We perform label encoding for converting the categorical feature ‘Species’ into a numerical one.
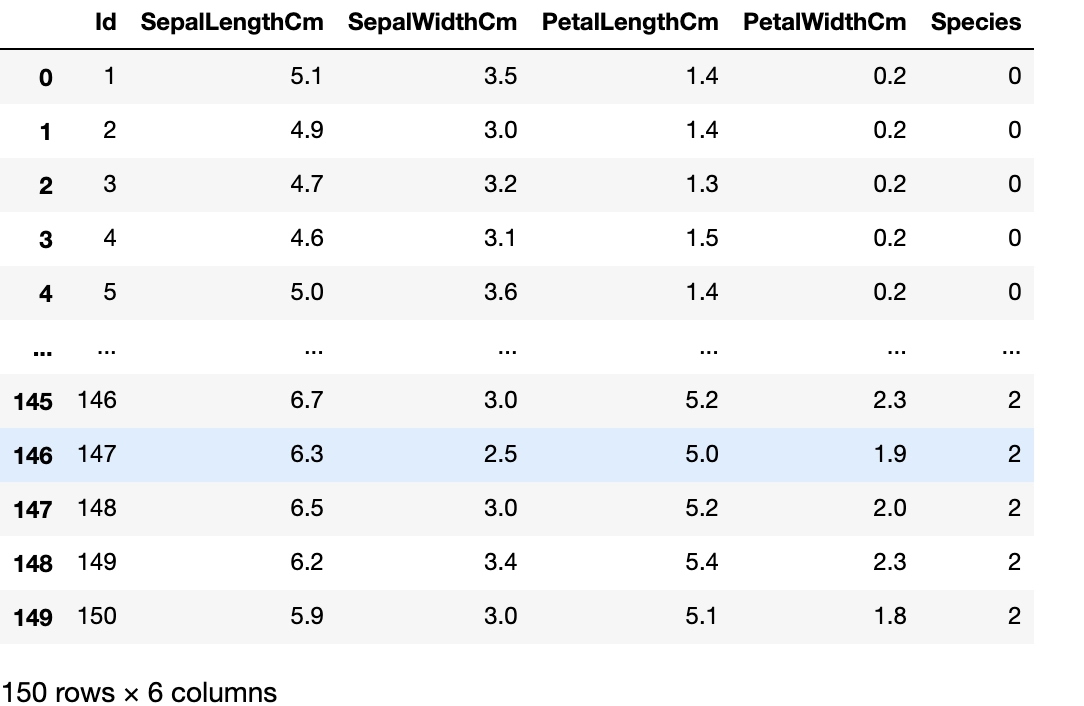
#Label Encoding - for encoding categorical features into numerical ones encoder = LabelEncoder() df['Species'] = encoder.fit_transform(df['Species'])
df
Output
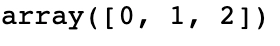
#finding different class labels np.unique(df['Species'])
Output
As noticeable above, all target values are now numerical.
Insignificant Features
We drop ‘ID’ as this feature is insignificant.
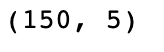
#DROPPING ID df= df.drop(['Id'], axis = 1)
df.shape
Output
Now, we have just 150 examples and 5 columns.
Train-Test Split
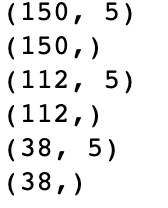
Now, we will divide our data into training data and testing data. We will have a 3:1 train test split.
#converting dataframe to np array data = df.values
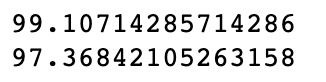
We notice that we get good results on both training and testing sets for KNN. The training set gives us a score of 99.10, whereas the testing set gives us a score of 97.36.
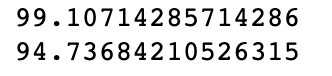
We notice that we get good results on both training and testing sets for KMeans too. The training set gives us a score of 99.10, whereas the testing set gives us a score of 94.73.
How to Find the Best K?
For KNN
Cross-Validation: Use cross-validation to test different values of K and select the one that provides the best performance in terms of accuracy, precision, recall, or another relevant metric.
Elbow Method: Plot the error rate for different values of K. Look for the "elbow point" where the error rate starts to diminish, indicating a good balance between underfitting and overfitting.
Domain Knowledge: Consider the context and specific requirements of your application to select an appropriate K. Domain expertise can provide valuable insights into the best K value.
For K-Means
Elbow Method: Plot the within-cluster sum of squares (WCSS) for different values of K. The point where the rate of decrease sharply slows down (the "elbow") indicates the optimal number of clusters.
Silhouette Score: Calculate the silhouette score for different values of K. The value of K that maximizes the silhouette score is typically considered the best choice.
Gap Statistic: Compare the total within-cluster variation for different values of K with their expected values under null reference distribution of the data to determine the optimal number of clusters.
Domain Knowledge: Leverage any domain-specific knowledge to inform the selection of K, as certain applications may have known or expected cluster structures.
Frequently Asked Questions
What is KNN Best For?
KNN is best for classification and regression tasks, particularly in situations where the decision boundary is complex and non-linear.
What is the Difference Between Nearest Neighbor and K-Nearest Neighbor?
Nearest neighbour refers to using the single closest data point for classification, while K-nearest neighbor uses the majority vote of the K closest points.
Why is KNN Called Lazy Learner?
KNN is called a lazy learner because it does not learn a discriminative function from the training data but memorizes the training dataset instead.
Conclusion
Congratulations on making it this far. This blog discussed a fundamental overview of both KNN and KMeans!!
We learned about Data Loading, Data Visualisation, Data Preprocessing, and Training. We learned how to visualize data then, based on this EDA, took significant decisions concerning preprocessing, made our models training ready, and finally generated the results for them.


 8+ registered

