Table of contents
1.
Introduction
2.
Line Plot
3.
Line Plots in Python
4.
Scatter Plot
5.
Scatter Plots in Python
6.
Frequently Asked Questions
7.
Key takeaways
Last Updated: Mar 27, 2024

Line And Scatter Plot

Author Ritik Arora
0 upvote
Career growth poll
Do you think IIT Guwahati certified course can help you in your career?

Introduction

Importance of Data Visualization
Data Visualization is the process of taking raw data and transforming it into graphs, charts, or images to derive meaningful insights from it.

It enables us to gain a qualitative understanding of the data by helping us identify new patterns, trends, outliers, and much more from the data. We can demonstrate the key relationships in the data along with the numerical measures in different plots and graphs, which can help us and the stakeholders gain an overall sense of the data.

Thousands of rows of data can be easily visualized in graphs and pie charts. For example, it would be straightforward for a product-based company to understand how their product is performing comparatively in different regions by visualizing the number of sales of the product in a pie chart rather than looking at only the sheer numbers of the sales.

Therefore, Data Visualization is an essential technique for businesses, and data can be expressed in different ways with the help of various plots such as the line plot, scatter plot, box and whisker plot, histogram plot, pie charts, and much more.

In this blog, we will be studying the line and scatter plots.


Introduction to Matplotlib
Matplotlib is a visualization library in Python that offers us a wide variety of visualizations such as line, bar, scatter, histogram, boxplot, and many more. We can create beautiful visual charts and graphs with ease and define our custom labels for the axes, the plot's title, the color of the plot, and a lot more. 


We can easily customize our draw and customize our plots using the functions under the pyplot module in matplotlib.

import matplotlib.pyplot as plt
You can also try this code with Online Python Compiler
Run Code


The above python code shows how we can import the pyplot and give it an alias called plt to use the functions available under the module.


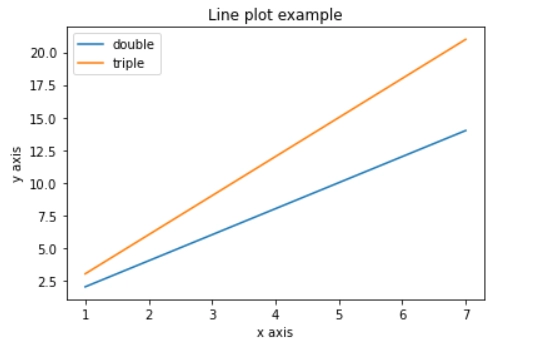
We will learn to utilize the pyplot module to generate line and scatter plots on a data sample in Python.


Line Plot

Line plots are used to display data which is collected at regular intervals or to show the relationship between two values, i.e., how an observation changes with the change in a specific variable. To give you an example, we could plot the change in population(observation) with time(variable) for a particular city on a line plot, or we could plot the temperature(observation) at different times of the day(variable).


Usually, the x-axis represents the variable, and the y axis represents the observation.
 

Therefore, line plots are helpful in presenting time series data as well as any sequence data where there is an ordering between observations.
 

Why are Line Plots effective?
 

We can understand why Line plots are effective by looking at this line plot.


This is a line plot for the monthly Sales(observation) each month(variable) for a company.


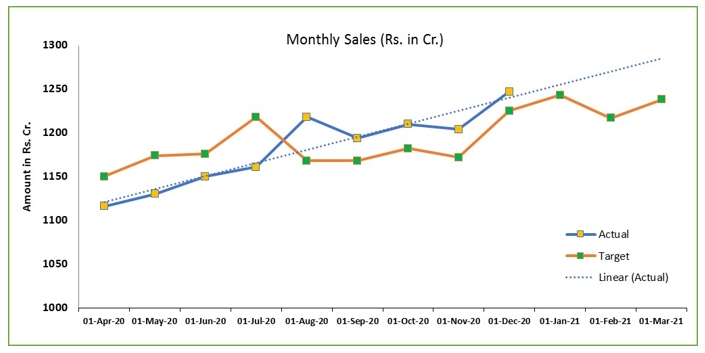
Source: excelinexcel.in


Looking at this plot, it is easy to understand the rate of the change of the Actual Sales and the target sales for each month. We can easily understand how our actual sales changed each month and have a practical comparison between the target and the actual sales. We can learn about the months in which the sales did not meet the target and the months in which the sales were higher than the target and by how much.


Line Plots in Python

As discussed before, we will be using matplotlib's module pyplot to generate line plots in Python.
 

Let us start by importing the necessary libraries and modules.

import matplotlib.pyplot as plt
import numpy as np
You can also try this code with Online Python Compiler
Run Code


Now let us create some sample data, which we will be plotting.

x1=np.array([1,2,3,4,5,6,7]) #Data points for x axis
y1=x1*2 #Double Value
y2=x1*3 #Triple Value
You can also try this code with Online Python Compiler
Run Code


Now we will use the .plot() function in pyplot in order to create line points for both (x1,y1) and (x1,y2).

plt.plot(x1,y1,label="double") #Plot (x1,y1)
plt.plot(x1,y2,label="triple") #Plot (x2,y2)
plt.xlabel("x axis")   #Provide a label to x-axis
plt.ylabel("y axis")   #Provide a label to y-axis
plt.title("Line plot example") #Provide a title to the plot
plt.legend() #Show the legend on the plot
plt.show() #Show the plot
You can also try this code with Online Python Compiler
Run Code


The image below is our final output plot.


Therefore, we can generate line plots of our data sample in Python within a few seconds!


Scatter Plot

A scatter plot uses dots to represent the relationship between two variables or data values.  The x-axis represents observation values for the first variable, and the y-axis represents the observed values for the second variable. Therefore, each point on the plot depicts the two variables, and we can observe the correlation between them. For example, we can create a scatter plot with the height of a person being on the x-axis and the weight of the person being on the y-axis and try to observe the correlation between them. 


Why are Scatter Plots used?

Scatter plots are effective at making us understand the correlation between the two variables. 


                                                                                                         Source: Chartio.com


As we can see in the above image, along with knowing the value of the two variables for a particular data point, we can also see their correlation as a whole. The correlation can be linear, non-linear, or there could be no relationship between the two. 

Scatter plots are also very effective in identifying clusters or groups in the data. 


                                                                                                             Source: Javatpoint
 

The above image is a scatter plot of Annual Income vs. Spending Score(1-100), and looking at this plot; it is easy to identify the different customer segments that exist in the market.


Scatter Plots in Python

Let us start by importing the necessary libraries.

import matplotlib.pyplot as plt
import numpy as np 
You can also try this code with Online Python Compiler
Run Code


Now let’s create some random data for the plot.

x = np.random.normal(2.0, 2.0, 1000)
y = np.random.normal(5.0, 4.0, 1000)
You can also try this code with Online Python Compiler
Run Code


We will now create a scatter plot of the above-generated data.

plt.scatter(x,y)
plt.show()
You can also try this code with Online Python Compiler
Run Code


The image below is our final output plot.


Check out this problem - Largest Rectangle in Histogram

Frequently Asked Questions

1). Why do we need a line plot?
We use line plots to analyze underlying linear patterns in data which is hard to observe by consuming data in Tabular form. It is similar to a scatter plot, but in a line plot, the points are connected by a straight line.

2). What is overplotting while using scatter plots?
Overplotting is caused by plotting many data points to the extent that they start getting overlapped to a degree, and it becomes hard to study relations between points and variables.

3). Is Matplotlib the only library to create line and scatter plots in Python?
No, there are other ways to create lines and scatter plots in Python. We can create box plots in pandas or by utilizing another visualization library in Python called seaborn.

Key takeaways

We learned about data visualization in this blog, understood line plots and scatter plots, and implemented them in Python. I hope this article gave you enough knowledge to continue to learn more and more about visualizations and gave you a sense of how line plots or scatter plots can act as a useful visualization tool.

Recommended reading:

Live masterclass