


Introduction
As technology advances and grows, people are connected, devices are connected. This leads to a massive increase in data and increased requirement of storage spaces. While the data is increasing, data hackers and crackers are creating various ways and algorithms to steal that data. Reduction of data dimensions was introduced to overcome such fear, and it can indirectly help in the security and privacy of data.

Source: Link
This article will contain a detailed description of Linear Discriminant Analysis, a dimensionality reduction technique. To understand dimensionality reduction, visit this article.
Before jumping to linear discriminant analysis, let us first understand Fisher’s linear discriminant.
What is Fisher’s Linear Discriminant?
Linear Discriminant Analysis is based upon Fisher’s linear discriminant. The FLD is a classification method that focuses on mapping the high-dimensional data points. The projection’s main idea is to maximize the data points between two classes and minimize the variance within the class variables.
Let us understand it with an example:
Suppose there is a dataset with the following points with two classes, red and blue.

Source: Link
Now according to the Fisher’s mathematical equations:

Where,
N1 and N2 represent the number of points in classes C1 and C2, respectively.
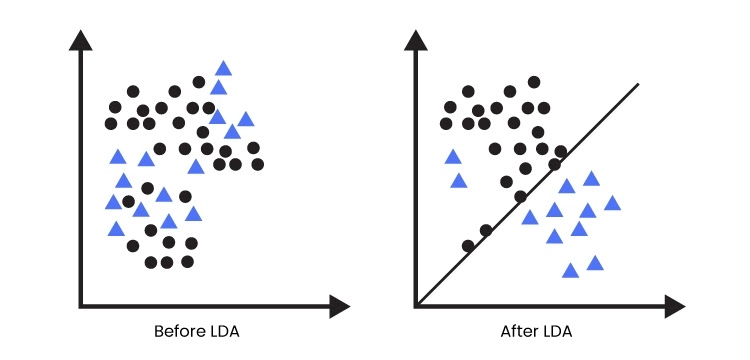
Projecting the hyperplane will ensure minimum variance and maximum data points between the classes.

Source: Link

Source: Link
In the image, it can be observed that the hyperplane has divided the data points. The red portion is for Class 1, the blue is for Class 2, while the yellow highlighted potion is the overlapped points.
Linear Discriminant Analysis is somewhat related to Fisher's Linear Discriminant theorem; let us understand it.


 8+ registered

