Do you think IIT Guwahati certified course can help you in your career?
Introduction
Linear Regression is a fundamental machine learning algorithm used for predicting continuous values by establishing a relationship between dependent and independent variables. It helps in understanding data trends and making accurate forecasts, making it widely used in finance, healthcare, and business analytics. This model is widely used in forecasting and trend analysis.
Now, let's dive deeper into regression problems and explore how they help in predicting real-valued outputs like price, using models such as Linear Regression.
What is a Regression Problem?
A regression problem deals with the prediction of real or continuous-valued output variables such as Price. Our goal is to construct an efficient model that can predict the relationship between dependent and independent variables. Out of many different models, linear regression is the simplest one.
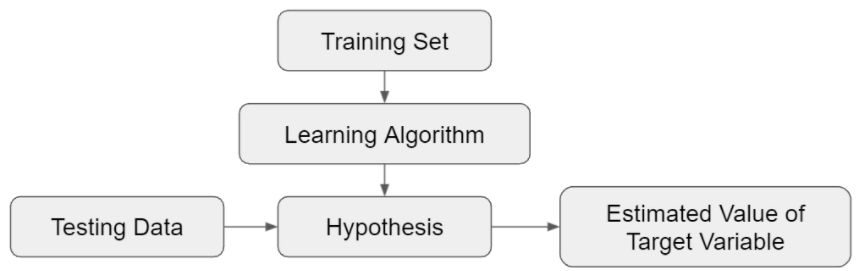
Below is a Flowchart for a better understanding of Regression Analysis
How Linear Regression works
Split the data into two sets, i.e., Training and Testing Data. Training data will train or teach the ML algorithm. In contrast, testing data will help validate the algorithm's predicted output and optimize it for better results.
There are two categories of variables in Linear Regression:
Dependent variable: The variable whose output we need to predict, also known as the Outcome variable.
Independent variable: It's the variable that we use to predict another variable's value. E.g., risk factors, predictors, or explanatory variables.
Linear Regression Analysis is the process of predicting the output of a variable based on values of other variables. The analysis aims to formulate a linear equation to predict the values of the dependent variable. The coefficients of the linear equation are estimated involving one or more independent variables.
For example, Below is a simple regression problem with a single dependent and independent variable (Y and x, respectively), the form of the equation would be:
Y = C0 + C1*x (Hypothesis)
We obtain a straight line with a single input variable (x), but when we have multiple inputs (x), the line becomes a Plane or hyper-plane. The complexity of linear regression increases with an increase in the number of coefficients used in the Model.
The input and output variables are also known as features and target variables.
Terminologies
Before moving on to the working of the linear regression algorithm, let's understand some basic terminologies in a simple linear regression.
The best-fit line for simple Linear Regression will be in the form of the equation given below.
Y = C0 + C1*x + e
Y: Dependent variable
C0: Y-axis intercept
C1: Slope of the line
e: Error in resultant prediction
Cost Function
The regression model aims to predict Y such that the error difference between the true value and the predicted value is minimal. So we keep on updating C0 and C1 to reach the best optimal value, which minimizes error to the least hence converting this search problem to a minimization problem.
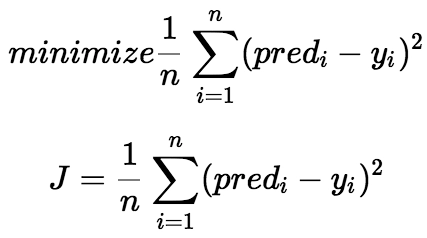
Linear regression's cost function (J) is the Mean Squared Error between the True and Predicted value. We square the error difference, sum it over all the data points, and divide it with the total number of data points.
Source: towardsdatascience.com
Gradient Descent
It's a method of updating C0 and C1 to minimize the Cost function (MSE). The idea is to start with random C0 and C1 and then iteratively change the values to reach the minimum cost.
Linear Regression Algorithm
Estimating coefficients is done by analyzing and reducing errors between real and predicted values to get the optimal output equation.
Below is the explanation of the Least Squares Method.
Using Least Squares to fit a line to the Data
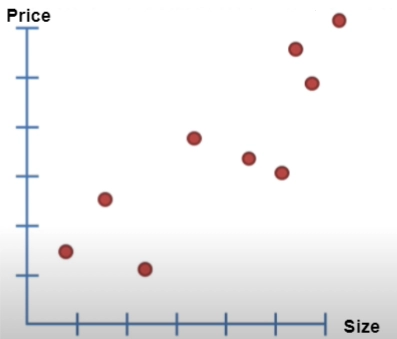
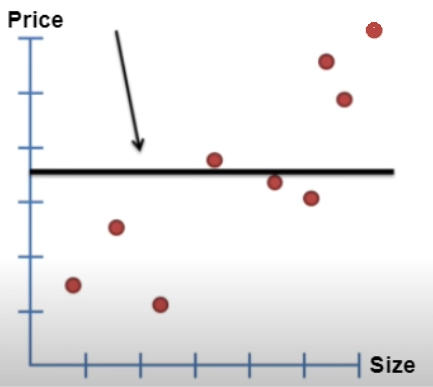
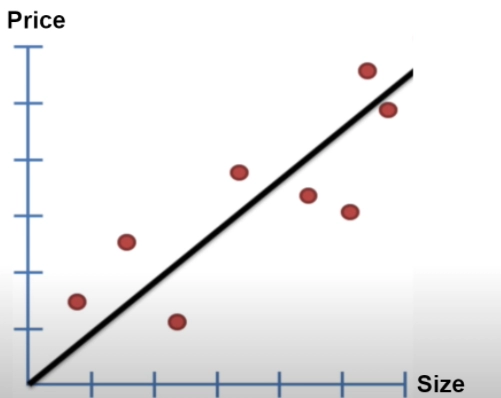
Assume we have the following plot for the Price of Real estate property against its size. There are a lot of factors in reality but let's take a more straightforward case.
2. A straight line is drawn through the data.
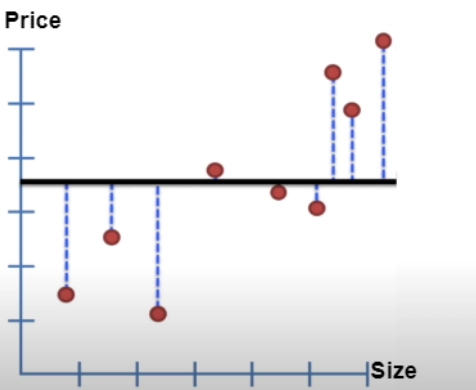
3. Residual is calculated by measuring the distance from the line to the data. Next, Square the distances and add them up.
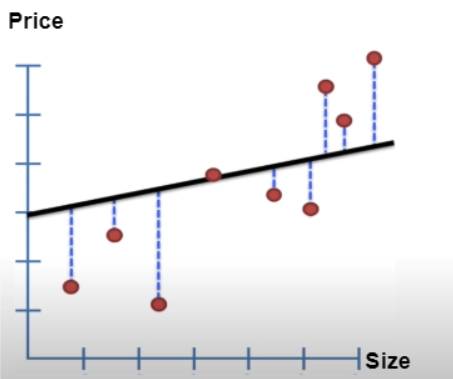
4. The line is rotated, and the same process is repeated.
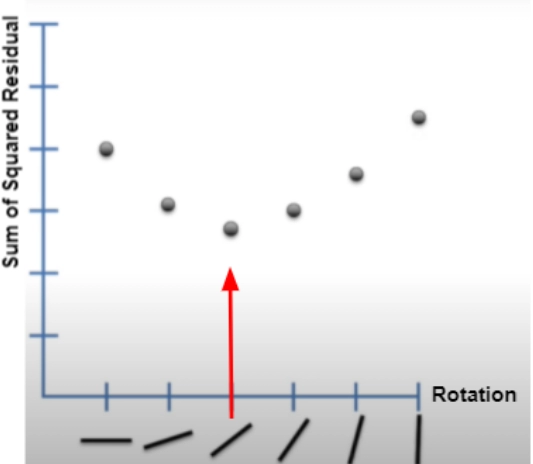
5. After some rotations, the Sum of Squared Residual plot is plotted against their corresponding rotation, and The rotation with the least sum of squares is selected.
The line with the least squared residual is obtained, giving us the linear equation's Y-axis intercept and slope. ( y = mx + c )
While Solving Regression Problems, We have a Hypothesis that consists of some parameters.
We select a cost function, and our goal is to minimize the cost function.
You must watch this video for the conceptual implementation of the “Linear Regression Algorithm”.
Types of Linear Regression with Examples
Multiple Linear Regression
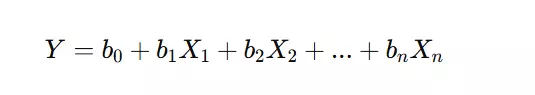
Multiple Linear Regression extends simple linear regression by incorporating multiple independent variables to predict the dependent variable.
How it Works: It follows the equation:
where multiple independent variables (X₁, X₂, ... Xₙ) influence the dependent variable Y.
Example: A company wants to predict employee salaries based on experience, education level, and job position. Here, experience, education, and position are independent variables, and salary is the dependent variable. Multiple linear regression helps in making accurate salary predictions based on these features.
Polynomial Regression
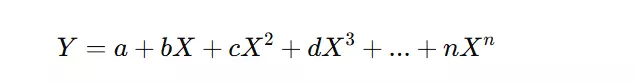
Polynomial Regression is an extension of linear regression that fits a non-linear relationship between the independent and dependent variables by adding polynomial terms.
How it Works: Instead of a straight line, it fits a polynomial curve to capture the non-linear pattern. The equation takes the form:
Example: If we analyze the growth of a company’s revenue over time, a straight-line model may not be accurate. A quadratic or cubic polynomial regression can better fit the revenue growth trend, capturing any acceleration or deceleration in growth.
Ridge Regression
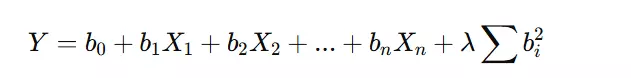
Ridge Regression is a type of regression that addresses multicollinearity (high correlation among independent variables) by applying a penalty (L2 regularization) to the regression coefficients.
How it Works: It modifies the standard linear regression equation by adding a regularization term to prevent overfitting. The equation becomes:
where λ is the penalty term.
Example: Suppose a company is predicting house prices using multiple features like location, size, number of rooms, and amenities. If some features are highly correlated (like number of bedrooms and total area), Ridge Regression helps stabilize the model by preventing over-reliance on these correlated variables.
Implementation of Linear Regression in Python
We start by importing the necessary libraries such as pandas, numpy, model_selection from sklearn, and Data is loaded from a local CSV file.
Load data using the .loadtxt function and specify the path to the dataset. (Please select the path according to where the file is stored in your device if you are trying to run this code on your device)
Importing libraries and loading data
import numpy as np
import matplotlib.pyplot as plt
from sklearn import model_selection


data = np.loadtxt("Linear Regression - Sheet1.csv", delimiter=",")
x = data[:, 0].reshape(-1, 1)
y = data[:, 1]
You can also try this code with Online Python Compiler
Below are some key points on How you must structure the data to get the best results from the Model.
Linear Assumption: Linear regression assumes the relationship between your input and output to be linear. In some cases, when there are a lot of attributes, Data transformation might be required to make the relationship linear.
Noise Removal: Data cleaning operations are recommended for better prediction of the output variable as linear regression can be very sensitive to outliers. e.g., removal of outliers in the output variable.
Remove Collinearity. Linear regression can over-fit data when highly correlated input variables are present. Pairwise correlations can be calculated for the input data, and the most correlated ones can be removed.
Rescale Inputs: Linear regression will make more reliable predictions if input variables are rescaled using standardization or normalization.
Why Linear Regression is Important?
Linear regression provides a straightforward way to understand relationships between variables, making it useful for predictive analysis.
Many complex machine learning algorithms, such as logistic regression and neural networks, build on the concepts of linear regression.
Businesses and researchers use linear regression to analyze trends and make data-driven decisions.
It helps in predicting future outcomes, such as sales, stock prices, and market trends.
Linear regression is effective even when there is limited data, making it a good starting point for analysis.
Applications of Linear Regression
Business and Sales Forecasting – Companies use linear regression to predict revenue, sales trends, and customer demand.
Risk Management – Financial institutions use it to assess risk in loans, credit scores, and investment decisions.
Healthcare and Medical Research – It helps analyze patient data to predict disease progression and treatment outcomes.
Real Estate Pricing – Used to estimate property values based on factors like location, size, and market trends.
Marketing Analytics – Helps in evaluating the effectiveness of advertising campaigns and customer engagement strategies.
Sports Analytics – Used to predict player performance and optimize team strategies.
Advantages of Linear Regression
Linear regression is simple and requires minimal computational power.
The relationship between variables is easy to understand and explain.
Provides accurate predictions when the data has a linear relationship.
Training and predictions are quick, even on moderately large datasets.
Applicable in business, healthcare, finance, and many other industries.
Disadvantages of Linear Regression
It does not work well when the data has complex, non-linear patterns.
A few extreme values can heavily impact the model’s accuracy.
It assumes that predictor variables are not highly correlated, which may not always be true.
Cannot capture interactions between multiple variables effectively.
Struggles with large, high-dimensional datasets that require more advanced models.
Frequently Asked Questions
What are the four assumptions of Linear Regression?
Linearity: There exists a linear relationship between the dependent variable Y and the independent variable x. Independence: There exists no relation between consecutive residuals in time-series data. Normality: Residuals of the Model are normally distributed. Equality of variance: The residuals have an equal variance for every level of x.
What is the difference between simple linear and multiple linear regression?
Simple linear regression has only one explanatory variable to predict the outcome of the dependent variable. In contrast, Multiple linear regression uses several explanatory or independent variables to predict the output variable.
Why do we square the error instead of using simple modulus?
We use square error to get the most negligible impact of values which contributes to the maximum error. Moreover, the squared error is differential while the absolute error is not, which makes the squared error more compatible with the Mathematical optimization techniques.
What is the limitation of Ordinary Least Squares (OLS)?
Ordinary Least Squares perform well with a smaller set of data. As the size of data grows, OLS becomes computationally expensive.
Conclusion
In this article, we discussed Linear Regression inMachine Learning, covering its fundamental concepts, working principles, and applications. We learned how this algorithm establishes a relationship between dependent and independent variables using a straight line. Linear Regression is widely used in predictive modeling, making it a valuable tool in data science and analytics. Understanding its assumptions, advantages, and limitations helps in effectively utilizing it for real-world problems.


 9+ registered

