Implementation
Importing Libraries
We have imported MiniBatchKMeans and KMeans models from the sklearn library. To make a dataset we are using the make_blobs function, and we will use matplotlib to plot the dataset. We will use the timeit library to measure the amount of time taken by each model to get trained.
from sklearn.cluster import MiniBatchKMeans, KMeans
from sklearn.datasets import make_blobs as mb
import matplotlib.pyplot as plt
import timeit as tm

You can also try this code with Online Python Compiler
Preparing the Dataset
Before creating the dataset we will define the centers for the clusters.
Creating a dataset having 1000 data points. The data points are divided into four clusters. The standard deviation around clusters is 200.
centre = [[0, 0],
          [1000, 0],
          [1000, 1000],
          [0, 1000]]
dataset, labels = mb(n_samples = 1000, centers = centre, cluster_std = 200)
You can also try this code with Online Python Compiler
Plotting the Dataset
Let us plot the dataset that we have created.
color = ['orange', 'purple', 'green', 'cyan']
for i in range(len(dataset)):
    plt.scatter(dataset[i][0], dataset[i][1],
                color = color[labels[i]], alpha = 0.3)
You can also try this code with Online Python Compiler

Training a Model Using K-means Algorithm
Training the model using the dataset we prepared and measuring the amount of time required to train the model.
kmeans = KMeans(n_clusters=4, random_state=0)
start = tm.default_timer()
kmeans.fit(dataset)
end = tm.default_timer()
a = kmeans.labels_
centers = kmeans.cluster_centers_
print(end-start)
You can also try this code with Online Python Compiler
Time taken to train the model:
0.08108869799980312
You can also try this code with Online Python Compiler
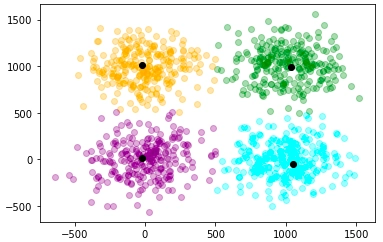
Let us plot the predictions of the model.
for i in range(len(dataset)):
    plt.scatter(dataset[i][0],dataset[i][1], color = color[a[i]], alpha = 0.3)
for i in range(len(centers)):
    plt.scatter(centers[i][0], centers[i][1], color = 'black')
You can also try this code with Online Python Compiler

As we can see that the clusters are formed with good accuracy. The black dots denote the centroid of the four clusters.
Training a Model Using Mini Batch K-means Algorithm
Let us train the model using a mini-batch k-means algorithm with a batch size of 20. Passing the same data through the model that we used for the K-means algorithm.
kmeans = MiniBatchKMeans(n_clusters=4, batch_size = 20, random_state=0)
start = tm.default_timer()
kmeans.fit(dataset)
end = tm.default_timer()
a = kmeans.labels_
centers = kmeans.cluster_centers_
print(end-start)
You can also try this code with Online Python Compiler
Time taken to train the model:
0.039445771999908175
You can also try this code with Online Python Compiler
Let us plot the predictions of the model.
for i in range(len(dataset)):
    plt.scatter(dataset[i][0],dataset[i][1], color = color[a[i]], alpha = 0.3)
for i in range(len(centers)):
    plt.scatter(centers[i][0], centers[i][1], color = 'black')
You can also try this code with Online Python Compiler
As we can see that predictions of the kmeans and mini-batch kmeans algorithm are nearly equal. But the major difference is the amount of time taken by the model to train. For a dataset of 1000 data points, the kmeans algorithm has taken 0.081 seconds, whereas the mini-batch kmeans algorithm has taken 0.039 seconds.
So making small batches of the dataset and training the model using the small subsets of the dataset is quite efficient.
FAQs
1. What is Mini Batch KMeans?
A: The Mini-batch K-means clustering algorithm is a variant of the traditional K-means algorithm. It stores data in memory in short, random, fixed-size batches, and then a random sample of the data is gathered and utilized to update the clusters with each iteration.
2. What is the elbow method in KMeans?
A: The elbow approach performs k-means clustering on the dataset for a range of k values (say, 1-10) and then computes an average score for all clusters for each value of k. The distortion score, which is the sum of square distances from each point to its assigned center, is computed by default.
3. What is distortion in Kmeans?
A: "Distortion," according to kmeans, is "the total of the squared deviations between the observations and the associated centroid." It is implemented as the sum of (unsquared) differences.
Key Takeaways
In this article we have discussed the following topics:
- Introduction to clustering and K-means clustering
- Definition of mini-batch k-means clustering
- Practical implementation of k-means and mini-batch k-means clustering to show mini-batch k-means if faster than k-means.
Want to learn more about Machine Learning? Here is an excellent course that can guide you in learning.
Happy Coding!


 6+ registered

