Monitoring Bigtable
Monitoring gives a detailed view of the usage of Bigtable. This can be done from the following places in the console.
- Bigtable cluster overview
- Bigtable table overview
- Key Visualizer
- Bigtable monitoring
- Bigtable instance overview
- Google Cloud's operations suite
-
Cloud Monitoring
It can also be monitored using the Cloud Monitoring API. Users can monitor performance over time by breaking down metrics for various resources and using charts for a given period. Cloud Monitoring can import usage metrics from Bigtable. Usage metrics can be viewed in the Metrics Explorer on the Resources page under Monitoring.
CPU Utilisation and Disk Usage
Nodes in a cluster perform various operations like reading, writing and other administrative tasks, all of which require CPU resources. The metrics for CPU utilisations are:
-
Average CPU Utilisation of all the cluster nodes.
-
CPU Utilisation of the hottest node: The hottest node is the busiest node that changes states frequently.
-
CPU Utilisations by methods, table and app profile.
Bigtable measures disk usage in binary units like Binary Gigabytes, also known as gibibytes (GiB). Storage metrics calculate data in the disk as of the last computation. Metrics used are:
-
Storage Utilisation in bytes and % of storage capacity used.
- Disk Load is calculated only for HDD clusters. It gives the maximum possible bandwidth of reads and writes in HDDs.
Instance and Cluster Overview
The Instance overview page displays the metrics of every cluster in real-time. Some of the key metrics are:
-
Average CPU Utilisation
-
Rows read
-
Rows written
-
Read throughput - It shows the amount of response data sent per second.
-
Replication latency for input
-
Replication intensity for output
-
System error rate - It displays the percentage of failed requests front the serverside of Bigtable.
The Cluster overview page helps users analyse every cluster's present and past status.
-
The number of nodes currently in use.
-
The Maximum node count target defines the maximum limit of nodes for autoscaling.
-
The Minimum node count target defines the minimum limit of nodes for autoscaling.
-
The recommended number of nodes for CPU and storage target.
-
CPU Utilisation
- Storage Utilisation
Key Visualiser
Monitoring the usage patterns of Bigtable can be done using Key Visualiser. It is a tool that helps users analyse and diagnose Bigtable. The visual reports generated by Key Visualiser give detailed insights into usage patterns that may be difficult to analyse otherwise. They can be used to improvise the existing schema designs and troubleshoot performance issues. Key Visualiser does not display all metrics responsible for the performance of Bigtable. Hence, additional troubleshooting along with Key Visualiser scans are needed to identify the causes for performance issues.
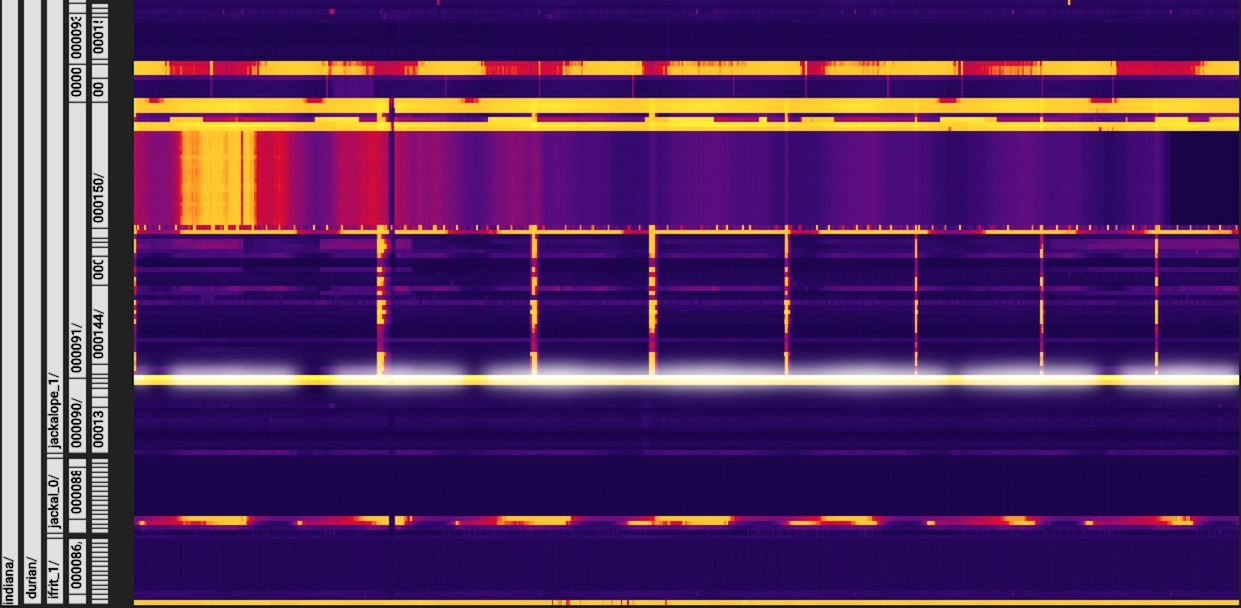
Key Visualiser scans consist of a heatmap with aggregate values on each axis. Heatmaps show the patterns of a group of keys over time. The x-axis represents time, and the y-axis represents the row keys. Low metric values for a row key are said to be “cold” and are denoted in dark colours. High values appear as light colours. Such visual patterns make it easy to diagnose problems with just a glance.
Exploring Heatmaps

Source: Google Cloud
The given picture denotes a heat map in Key Visualiser. Issues identified by the Key Visualiser are displayed above the heatmap as diagnostic messages. The usage of a particular resource determines high and low values. If warning and performance metrics appear in bright colours, the Key Visualiser detects a potential problem.
Colours in the heatmap can be adjusted using the +/- buttons on either side of the Adjust Brightness option. Increasing the brightness decreases the range of values represented by that colour and vice versa.
Users can use Rectangular Zoom to enlarge a particular area in the heatmap to get a closer and more detailed look. This helps notice issues for a specific period.
Row keys represent a hierarchy of values, each having an identifier to capture usage and a timestamp. Users can drill down into the data of a heatmap using a common prefix shared by a group of row keys. Specific row-key hierarchies can be selected from the left side of the heatmap. The key prefix for all the row keys at that level is also displayed.
Details about a metric are shown as a tooltip when the cursor moves over the heatmap. Tooltips can be pinned by clicking on the heatmap. The ops metric gives an overview of the usage pattern for a table. Users can switch metrics by choosing one from the Metric drop-down list above the heatmap.
Heatmap Patterns
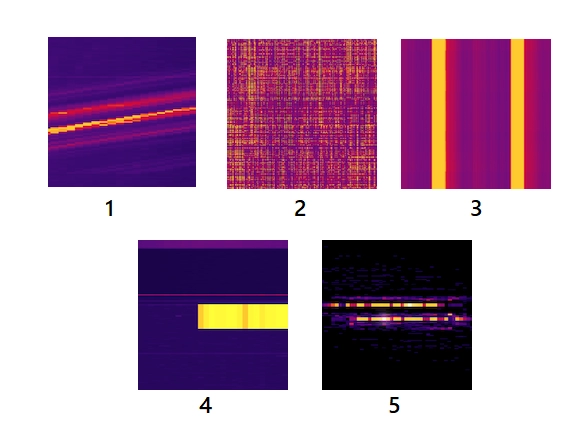
Five main heatmap patterns are frequently spotted.

-
The pattern denotes sequential reads and writes. The diagonal line implies the access of contiguous key ranges in sequential order.
-
The pattern represents evenly distributed reads and writes. The fine-grained texture shows an effective usage pattern.
-
Alternating bands of dark and light colours show that the key ranges are accessed only at specific periods and not always.
-
An abrupt change from dark to light colour denotes a sudden increase in adding or accessing rows in a specific period.
- Horizontal lines of light and dark colours can represent hot key ranges, usually while performing larger reads and writes.
Diagnostics
Diagnostic messages help identify issues in performance data while observing a Key Visualiser scan. The messages can include a Warning symbol or Danger symbol to denote the problem-causing rows. Following are some of the diagnostic messages.
-
High read pressure
-
High write pressure
-
Larger rows - It notifies that some rows in the table exceed 256MB of data.
-
No data scanned - This implies no performance data for the table.
-
Keyspace not to scale - If a table contains a small number of rows, the Key Visualizer cannot evenly distribute the row keys into buckets.
-
Not all details are shown in Tooltip.
- Values per row are approximate.
Frequently Asked Questions
What is a latency-sensitive application?
Latency is the time interval between the occurrence of an event and its handling. Reduced latency improves performance. A latency-sensitive application is an application that reacts fast due to specific circumstances.
What are the different Warning metrics of Bigtable?
Read pressure index and Write pressure index denote a row key or range that involves CPU utilisation and latency for reads and writes, respectively. Large rows indicate that that row data exceeds 256MB.
What key points to consider while testing a Bigtable application’s performance?
Test with enough data and note the storage utilisation per node. Run a pre-test for several minutes before actually running the main test. Perform the test for a minimum time of 10 minutes to ensure a thorough test of all data.
Conclusion
This blog discusses the Monitoring and troubleshooting of Cloud Bigtable applications. It explains the factors that affect the performance of Bigtable and how to monitor them. It also gives an overview of the Key Visualiser and its features.
Check out our articles on Cloud Logging in GCP, Monitoring Agent and Identity Access Management. Explore our Library on Coding Ninjas Studio to gain knowledge on Data Structures and Algorithms, Machine Learning, Deep Learning, Cloud Computing and many more! Test your coding skills by solving our test series and participating in the contests hosted on Coding Ninjas Studio!
Looking for questions from tech giants like Amazon, Microsoft, Uber, etc.? Look at the problems, interview experiences, and interview bundle for placement preparations.
Upvote our blogs if you find them insightful and engaging! Happy Coding!


