


Introduction
Pivot Table is one of the most powerful features of excel. I will just try to tell you what is the difference between a normal table and a pivot table. Normal tables are fixed while pivot tables are flexible; normal tables give you entire data, whereas pivot tables give you summarized data, or you can say subtotals of each record, or you can say each distinguished record. In this article, we see how to create a multilevel pivot table.
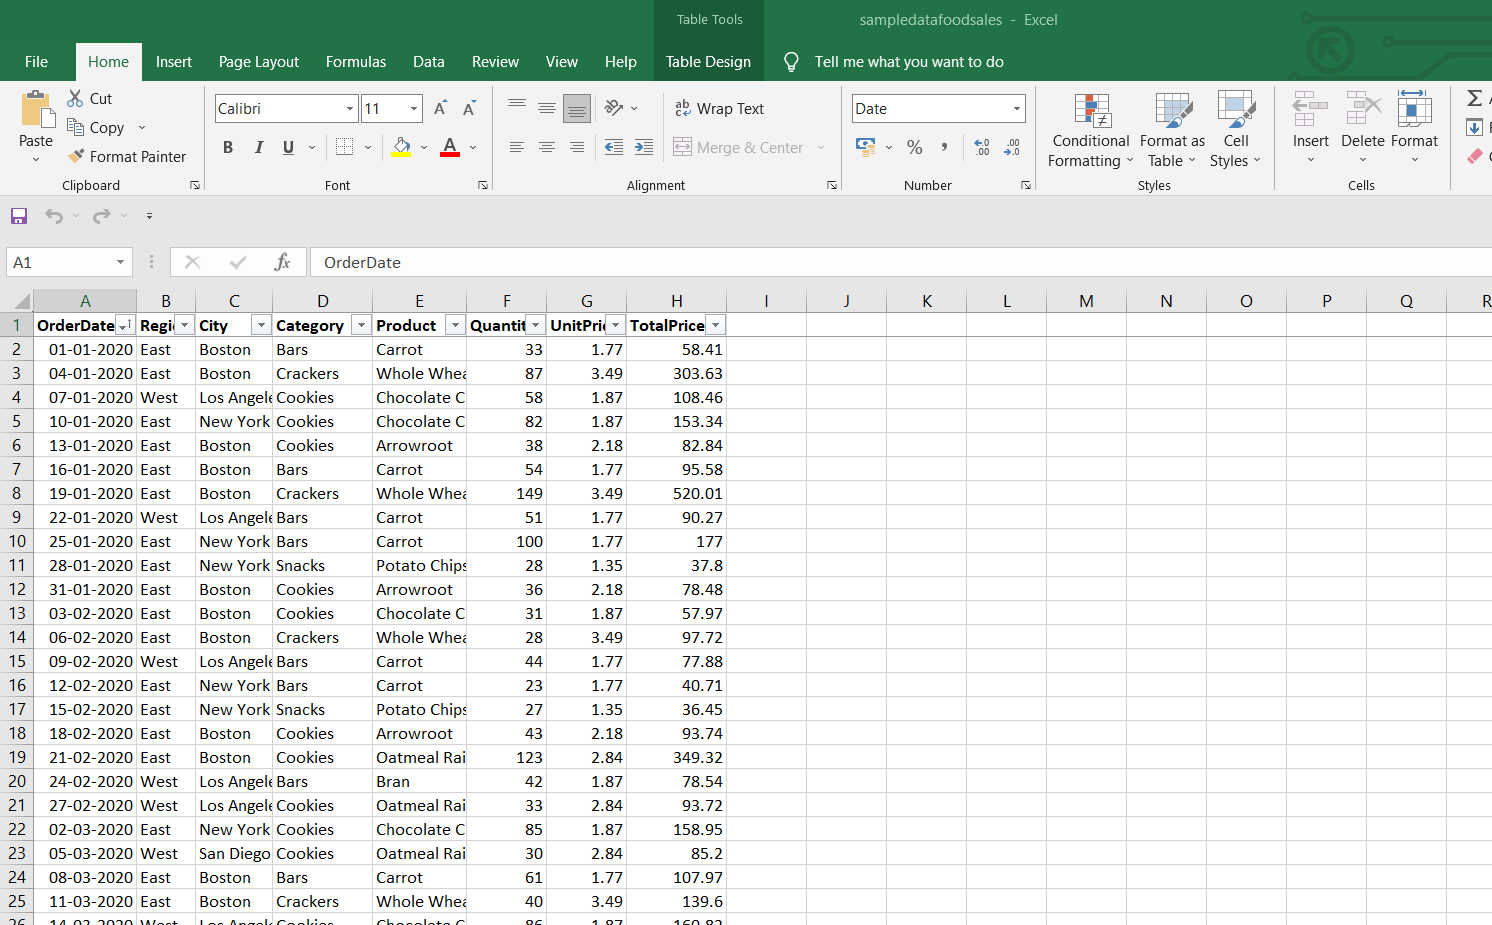
You can download the dataset from here. I have chosen the Food sales dummy data and will create a pivot table for this.
Step 1: Open the dummy Food sales data in excel it will look like this
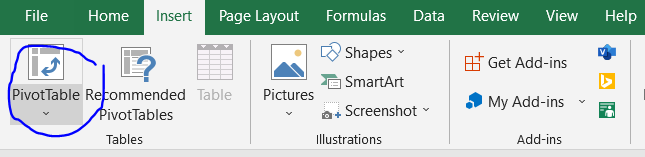
Step 2: While creating the pivot table, make sure that there is no blank record in your table first. Select the part of the table which you want to make a pivot table, then select insert from the top menu, and then select pivot table.
This will give you the popup box shown below
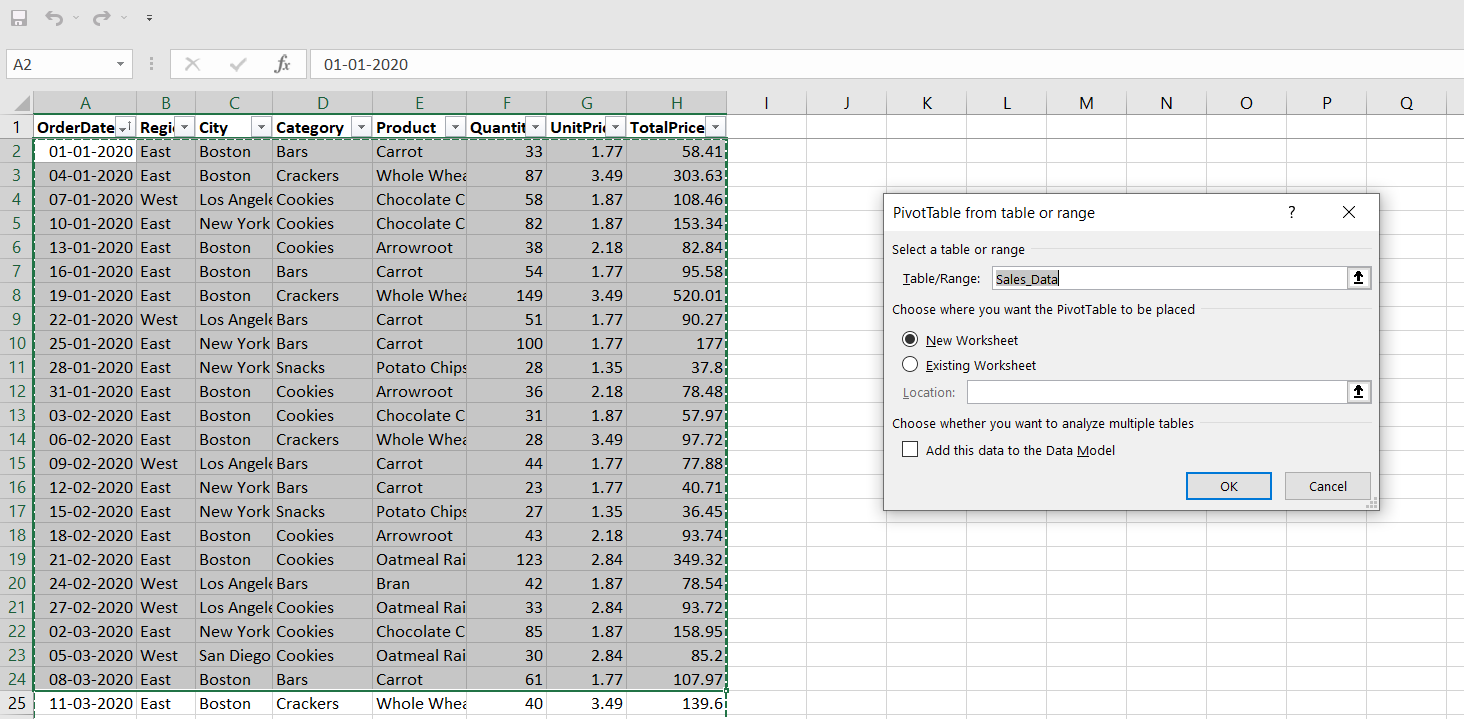
Step 3: In this popup box, I will choose the existing worksheet because I want my pivot table in the existing worksheet; you can even choose the new worksheet, and I will provide the location of the cell, and that will be the starting point of my sheet.
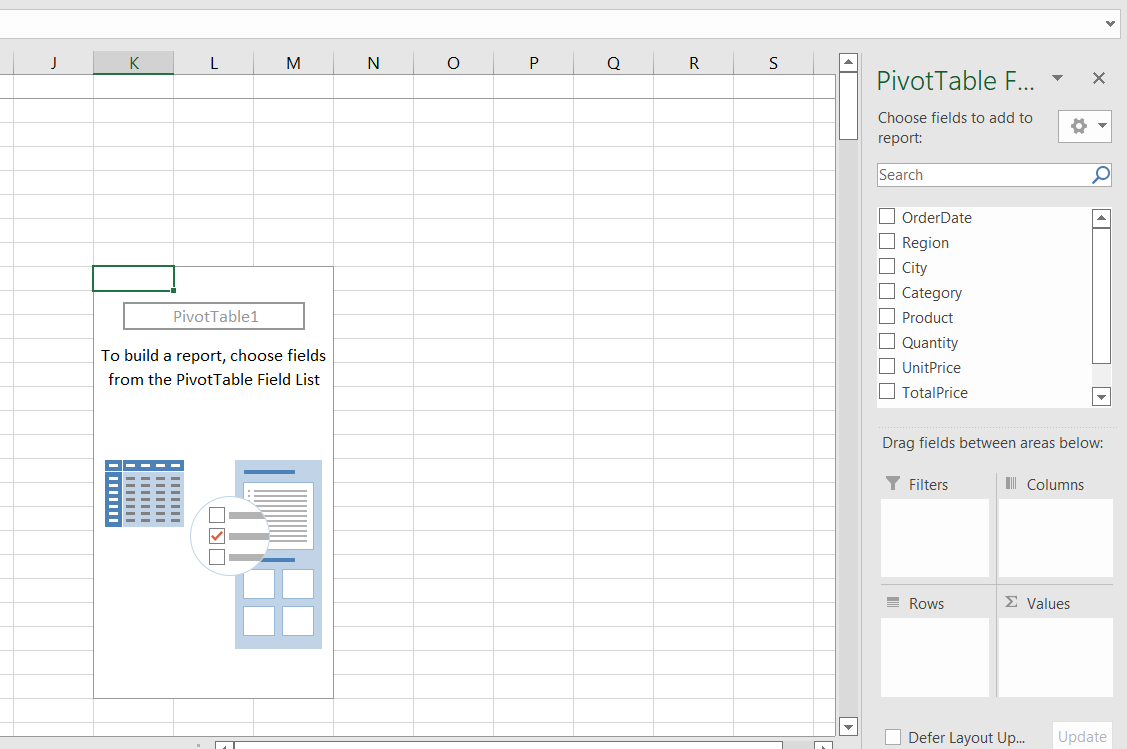
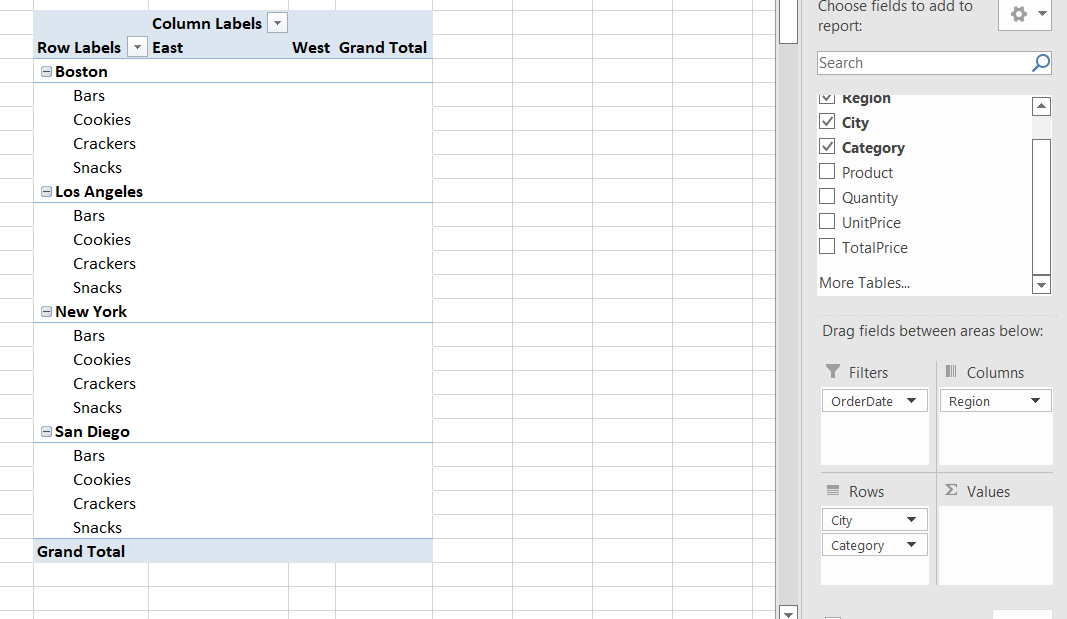
This will give me a blank pivot table, but if you observe, I have got something which is pivot table fields. Now what exactly fields mean is, these are the names of the column headings. If you observe here you have this city, category, region, etc. so these are the column headings in this pivot table field list. I have all the column's names, and it has been divided into four partitions : rows values, columns, and filters.
Step 4: Now, I can drag these columns in any of these fields to make my pivot table. I have dragged the order date in filters, date city, and category into rows, region into a column which will make a pivot table as shown below.
FAQs
-
What is the use of a pivot table?
A PivotTable is a dynamic approach to summarize vast volumes of data rapidly. A PivotTable can be used to study numerical data in depth and to answer unexpected queries about your data. A PivotTable is ideal for: Querying big volumes of data in a variety of user-friendly methods. -
What is the real word use of pivot table?
Pivot tables are used to make data more presentable. This can be used anywhere,it is highly used by government employees while working with a large set of government data.


 9+ registered

