Code360 powered by Coding Ninjas X Naukri.com. Code360 powered by Coding Ninjas X Naukri.com
Table of contents
1.
Introduction
1.1.
Features are simply the independent variables plotted on the x-axis.
2.
Cost function
2.1.
 
3.
Gradient Descent algorithm for univariate Regression
4.
Implementation of Gradient Descent
5.
Multivariate Linear Regression
5.1.
Hypothesis function :
6.
Cost function of Multivariate Regression 
7.
Gradient Descent in Multivariate Regression
8.
FAQs
9.
Key Takeaways
Last Updated: Mar 27, 2024

Multivariable Regression and Gradient Descent

Author Rajkeshav
0 upvote

Introduction


In simple words, Regression is the process of estimating the relationship between the dependent and independent variables.

Linear Regression is a technique to describe a linear function that fits a best-suited line to the data points. Best suitable means the sum squared error for each data point to the bar is minimum.

A few examples of the Regression problem can be the following

1. "What is the market value of the house?" 

2. "Stock price prediction." 

3. "Sales of a shop." 

4. "Predicting the height of a person."


We will use the following terms in our discussion:


1) Features

Features are simply the independent variables plotted on the x-axis.

E.g., for house data, the features are the size of the house, no. of bedrooms, no. of kitchens, etc.


2) Target: The target variable is the output or dependent variable whose value depends on the independent variable.

E.g., for house data, the pricing of a house is the target variable whose value is dependent on the features of the house.


3) Hypothesis function: The hypothesis function is the function that fits a linear model to the data points. It is the general equation of a line given as:

Y=m1X1+m2X2+m2X3+...+mnXn+C

Y is the dependent/target variable.

M1,m2,m3...mn are the slope parameters of the line in multiple dimensions.

X1, X2, X3…, Xn are the features or independent variables.

C is the Y-intercept of the linear Regression line.


If we restrict ourselves to only one independent variable, the equation will look like Y=mx+C.
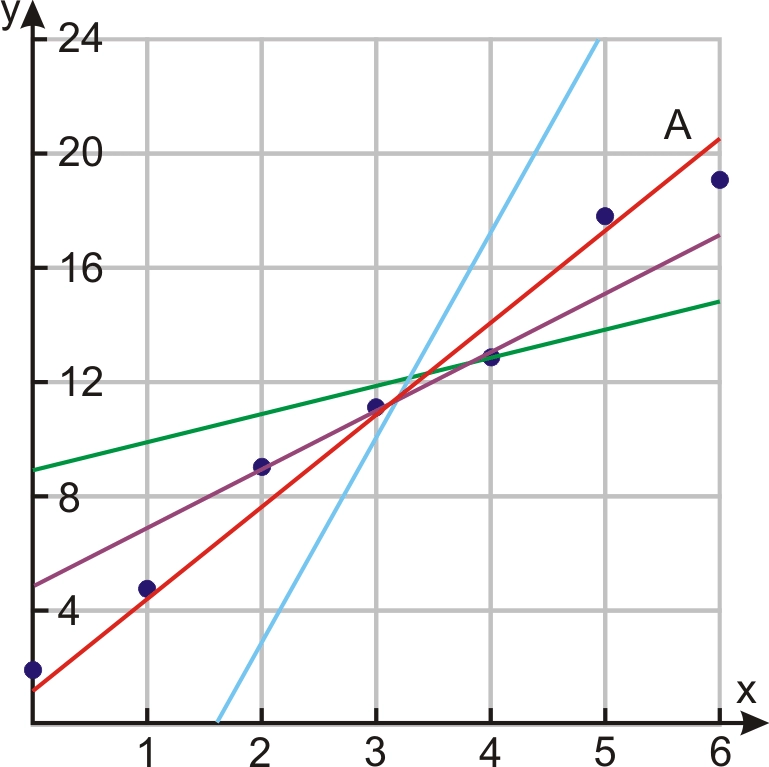
 

Source: ck12.org


The value of Y gives us the predicted value of the given input variable. There could be multiple lines that seem to fit our data. But, we have to select the best fit line out of all. In other words, the magnitude of the sum of squared differences between the actual and predicted values should be minimum.
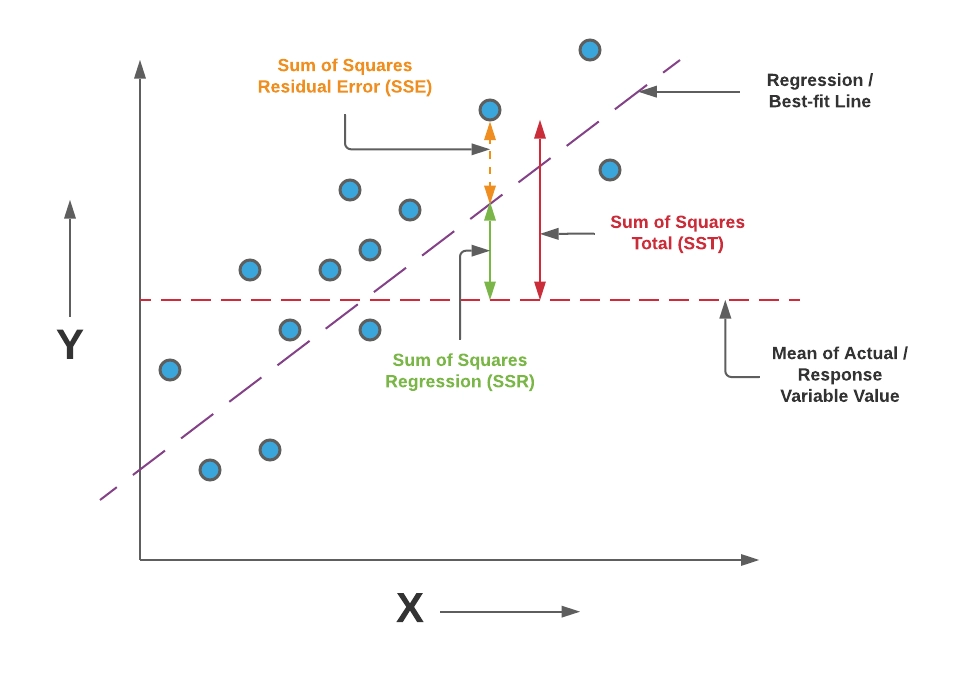
 

Source: vitalflux.com


If yi is the actual output and,

,  is the output predicted by the Regression line

Then squared sum error is = .

Where m is the number of datasets.


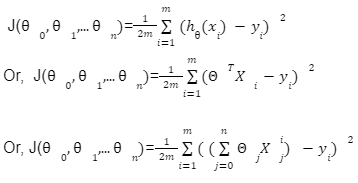
We can check the accuracy of our hypothesis function by using the cost function:


Cost function


The goal is to find the minima the above cost function 


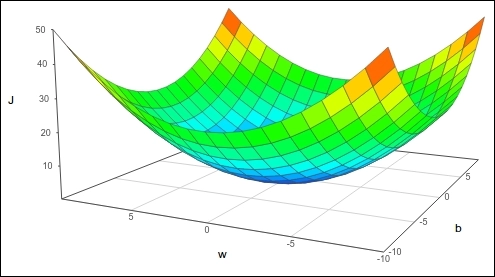
The plot of our cost function would like:
 

Source: concise.org


The plot will look like a 3-D parabola. We won't be dealing with 3-D parabola; instead, we will be dealing with "Contour plots."

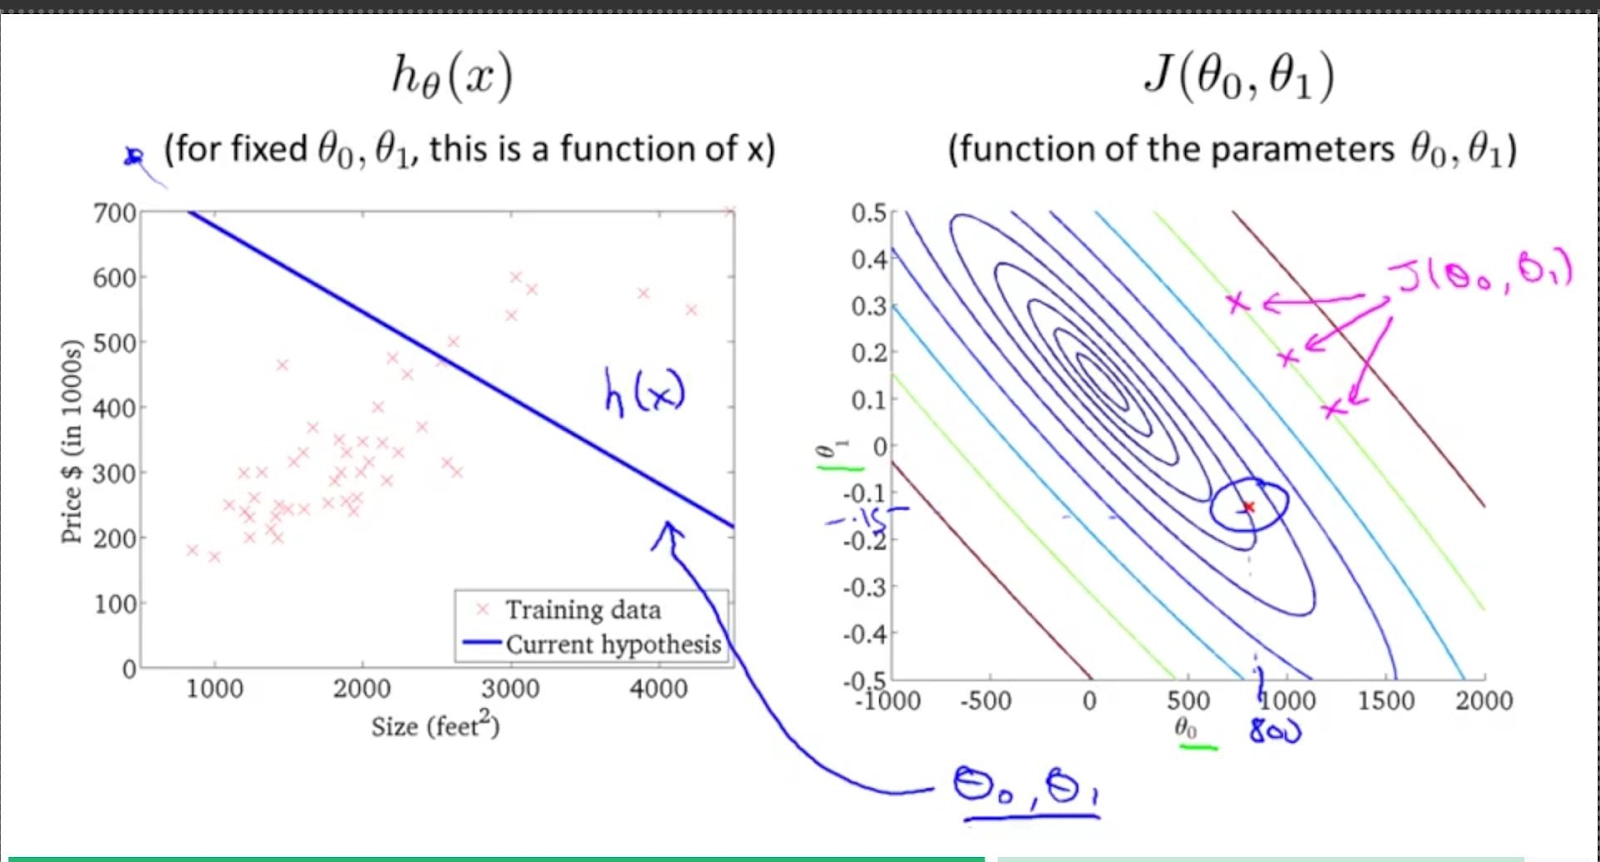
A contour plot is a graphical technique to represent a 3-D model in the 2-D plane by plotting z slices.
 

Source


All three points x1,x2,x3 drawn in magenta have the same value for 

 .


Gradient Descent algorithm for univariate Regression


The Gradient Descent Algorithm is used to minimize any function. Here, our objective is to minimize the cost function .


Outline:


  • Start with some , say .
  • Keep changing 0,1to reduce J(0,1) until we hopefully end up at a minimum.


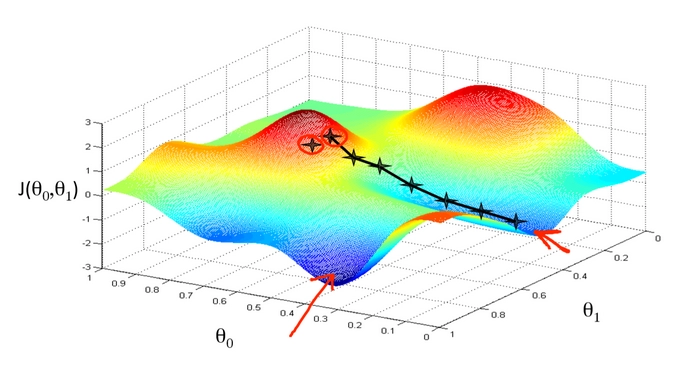
We put 0  on the x axis and 1on the y-axis, with the cost function on the vertical z-axis. The points on our graph will result from the cost function using our hypothesis with those specific theta parameters. The chart below depicts such a setup.

                                            Minimum point 

Source: medium.com


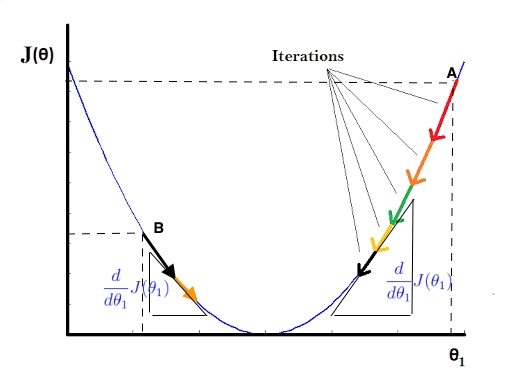
We would have succeeded when our cost function is at the very bottom of the pits in the graph. The way of doing this is by taking derivatives of the cost function. The tangent slope is the derivative at that point and will give us a direction to move. We make steps down the cost function in the order of the steepest descent.  The size of each step is decided by the parameter  ‘,’  which is called the Learning rate.

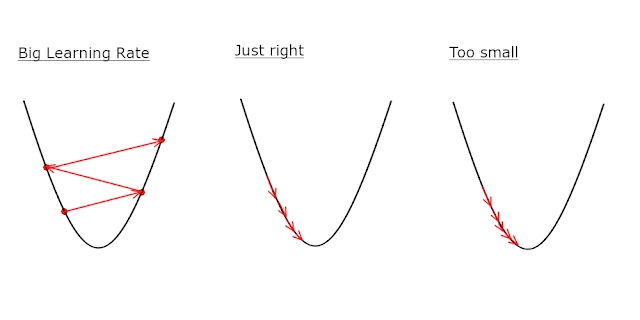
Smaller  ‘' would result in a minor step, and larger  ‘' would result in a giant step.


The Gradient Descent algorithm is:

Repeat until convergence {

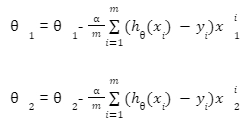
Where j=0,1 represents the feature index number. At each iteration j, one should simultaneously update the parameter .


Updating a specific parameter before calculating another one would yield a wrong result.


Implementation of Gradient Descent


Regardless of the slope, the sign for  eventually converges to its minimum value.


Source: machinelearningmedium.com


If  is set too big every time; then, we might end up with the wrong result.


Sourcemedium.com


Multivariate Linear Regression


Previously we had only one variable, Linear Regression. We could also have multiple variables Linear Regression. Multivariate Linear Regression is quite similar to the simple Regression model that we discussed previously, but in Multivariate Linear Regression, we have numerous independent variables contributing to the dependent variable.


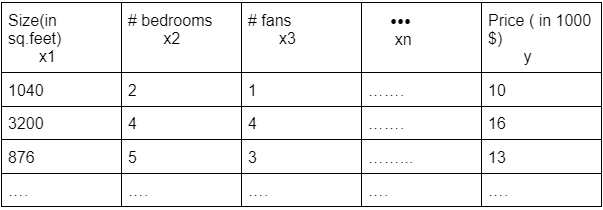
Previously we had two features, one is Size(Independent), and the other is Price(dependent)


So, we assumed .

What if we have multiple features in Regression:


Here we have n features ( x1, x2, x3, … , xn) and price y.

We now introduce the notation for equations where we have any number of input variables.


Hypothesis function :


For the sake of simplicity,


is the transpose of the matrix 


Cost function of Multivariate Regression 


Gradient Descent in Multivariate Regression


Repeat {

}


Let’s calculate at j=0,1,2,...


Similarly,


Repeat till convergence{

.

.

.

}


In this way, we can determine the unknown parameters. 


FAQs


Q1) Where do we use Multivariate Regression?


-> Multivariate Regression is used when we have more than one independent variable. In the real world, data has multiple features hence, simple Linear Regression is not able to solve the problem.


Q2) What is the significance of the Cost function in Regression?


-> Using the Cost function, we can train our data to make the hypothesis more accurate. The Cost is also called the Squared Sum error function.


Q3) What is the significance of the Gradient Descent Algorithm?

-> Gradient Descent algorithm is an Iterative way to find the local minimum of a function. The Accuracy of the algorithm is dependent on the number of iterations and the Learning rate.


Q4) What do you mean by Learning rate?


-> Learning rate in Gradient Descent decides the size of steps taken to reach the local minimum. It also determines the rate of convergence and the fastening of the algorithm. Learning rate  range between 0.0 to 1.0. We should carefully choose the Learning rate to get the accurate result in lesser iteration.


Q5) What do you mean by Feature scaling in Gradient descent algorithm?


-> We Scale the features, i.e., make features on a similar scale by dividing the features by the highest value to make the ranges between 0-1.This is called Feature scaling. 


Key Takeaways


I hope I was able to deliver the actual concept behind these algorithms. There are various exciting Machine Learning algorithms apart from Regression. If you are interested, you can find them here

Thank you a lot, Happy Learning😊


Live masterclass