Do you think IIT Guwahati certified course can help you in your career?
Introduction📝
Application Programming Interface (API) Testing is all that Postman is used for, a software programme to test API. Developers can quickly design, share, test, and document APIs using an API client. It allows users to make, save, and read both straightforward and combined HTTP/s requests. The outcome is more effective because of this. This tool utilises a method in which the request is transmitted from the client to the server. This is usually employed today. To read more about Postman, Read our dedicated Blog here.
Observing and Viewing an API in Postman is the exclusive topic of discussion in the blog. Let us start with our discussion.
🚀Observing an API
Postman monitoring can be used to track the functionality and accessibility of your APIs. View monitor results in the API Builder after linking a collection-based monitor or an uptime monitor in Observing and Viewing an API in Postman.
Slack, Splunk, and other channels can get the output of collection-based monitors thanks to monitoring integrations. Additionally, Postman allows you to monitor application performance management (APM) metrics from New Relic or Datadog. Let’s learn more about it in further sections.
🚀Linking collection-based monitors
You can connect collection-based monitors to an API version in your current workspace. This makes it possible for you to check an API's efficiency and response times periodically. You can add an existing monitor or create a new one from the Monitoring tab of an API version in Observing and Viewing an API in Postman.
🚀Creating a New Monitor
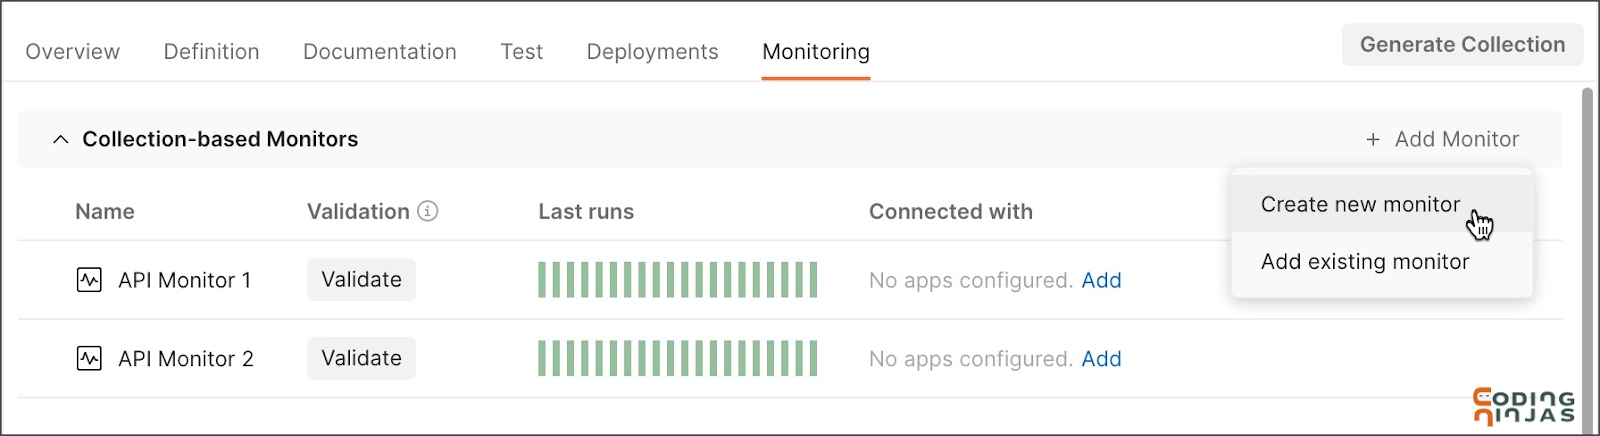
Select Add Monitor and then Create a new monitor under Collection-based Monitors on the API version Monitoring tab.
You can establish a new collection, use an existing one, or construct one from your API schema.
⭐Generate a collection from a schema
🎯Specify the collection's name
🎯Select Show advanced settings to set the collection's generation parameters
🎯Continue by selecting Generate collection
⭐Use an existing collection
🎯Use the dropdown list to select an existing collection
🎯To continue, select Select Collection
⭐Create a new collection
🎯Add the requests you wish to keep an eye on, including the method, URL, desired status code, and response time.
🎯Continue after selecting Create Collection.
Adding an existing monitor
To add an existing monitor to your API:
⭐Choose Add Monitor and Add existing monitor from the drop-down menu next to
⭐Collection-based Monitors on the API version Monitoring tab.
⭐From the list, choose Add Monitor after selecting a collection-based monitor. The list of monitors in your current workspace is displayed.
🚀Connecting to Monitor Integrations
With the help of Postman connections, you can send the output of collection-based monitors to several other channels and programmes, including Slack, Microsoft Teams, Datadog, and Splunk. You can send monitor results to a custom webhook to connect Postman monitoring with your unique system.
🚥To manage all your API integrations for collection-based monitors, go to the Monitoring tab in the API Builder. You can establish a new integration, monitor outcomes, and check the monitor integrations you've already set up.
🚀Adding a Monitor Integration
To deliver collection-based monitor results to other applications that are a part of your API development workflow, connect an API version to one or more monitoring integrations. When installing a monitor integration, the monitor is automatically associated with the API version while Observing and Viewing an API in Postman.
🌞Create the collection-based monitor you wish to link to your API if you haven't previously.
🌞Open a version of an API, then choose the Monitoring tab.
🌞Choose a monitor integration under Connect Postman to your monitoring workflows.
🌞Choose a monitor and enter a nickname for the integration. Postman will send the findings of this monitor to the programme you are integrating with.
🌞Carefully enter the necessary data. Depending on the application you're integrating with, this information may or may not include an API key. Visit Integrating with Postman and choose Available integrations in the left menu pane for more information on a specific application.
🌞Select the Add integration
🚀Working with Monitor Integrations
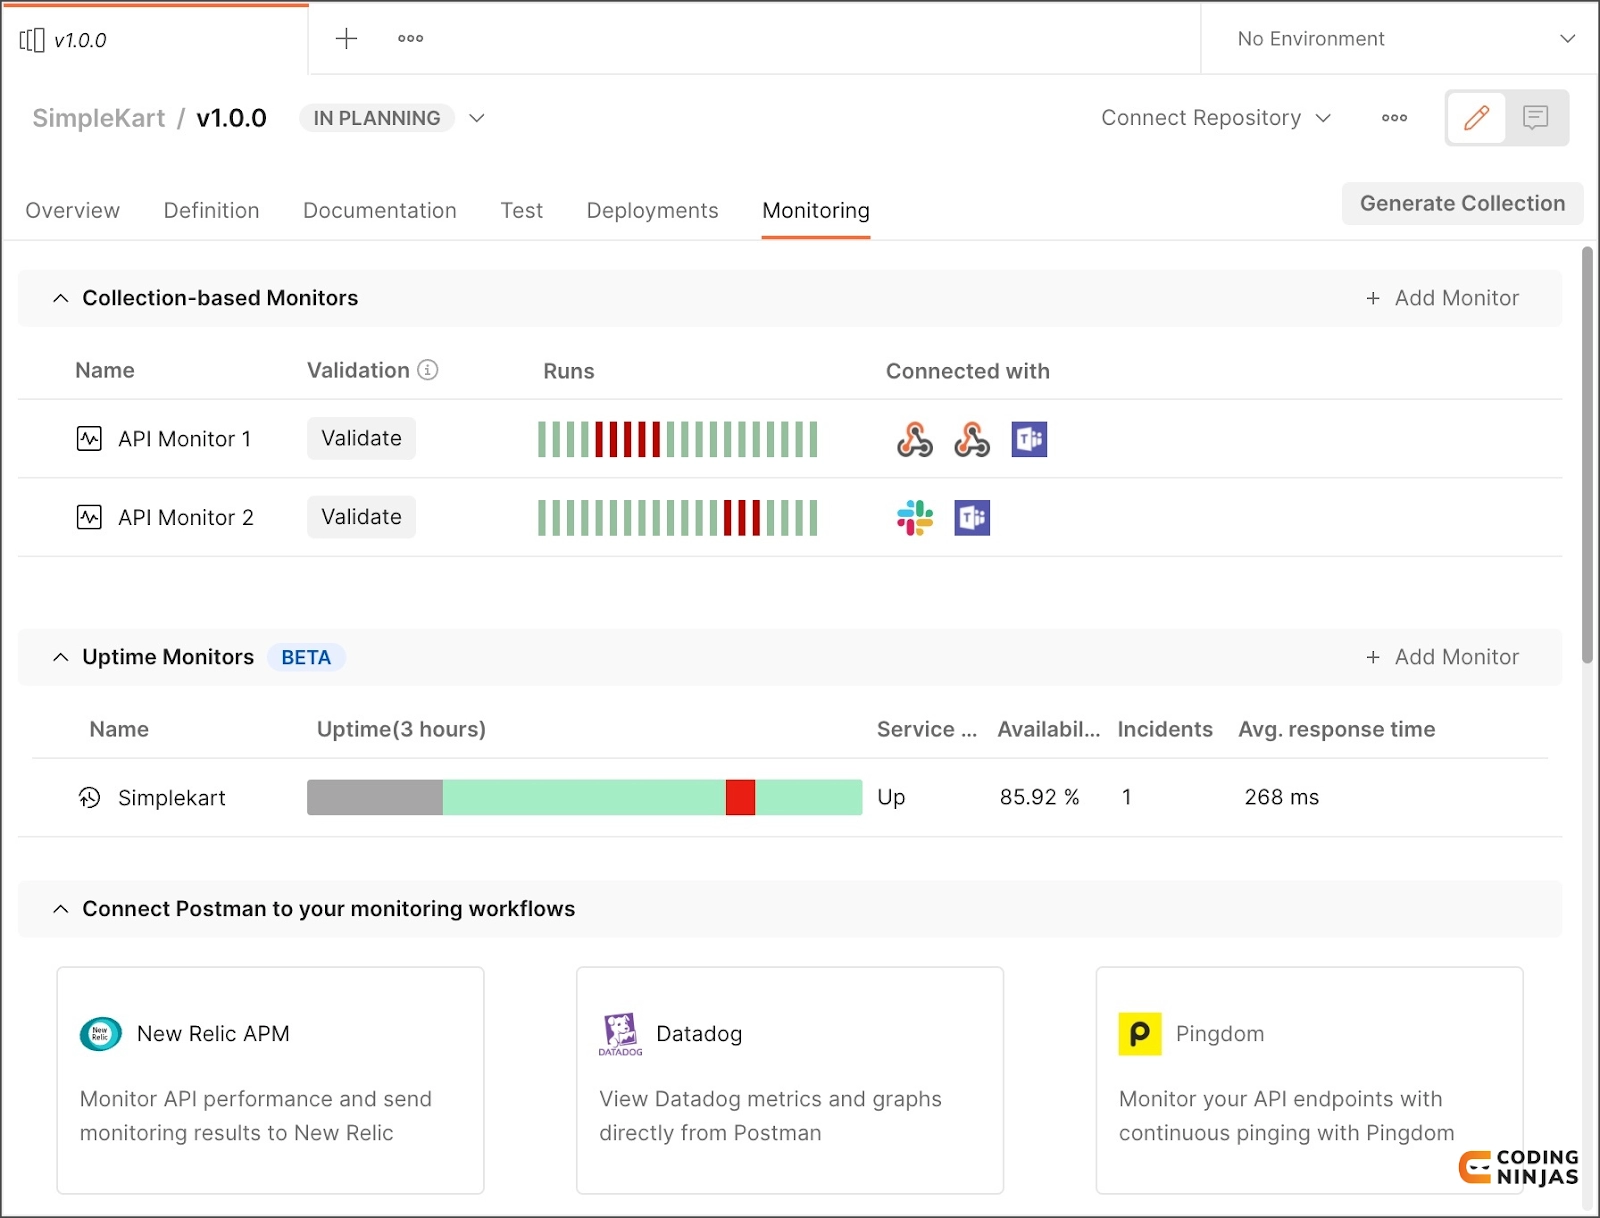
On the Monitoring page, after adding a monitor integration to an API version, you can do the following things:
🌞To access a monitor's dashboard in a new tab, click on its name.
🌞To verify a monitor against the API schema, select Validate next to the monitor (OpenAPI 3.0 schemas). Select Issues found, then select Review issues if validation is unsuccessful. 🌞Find out more about API validation.
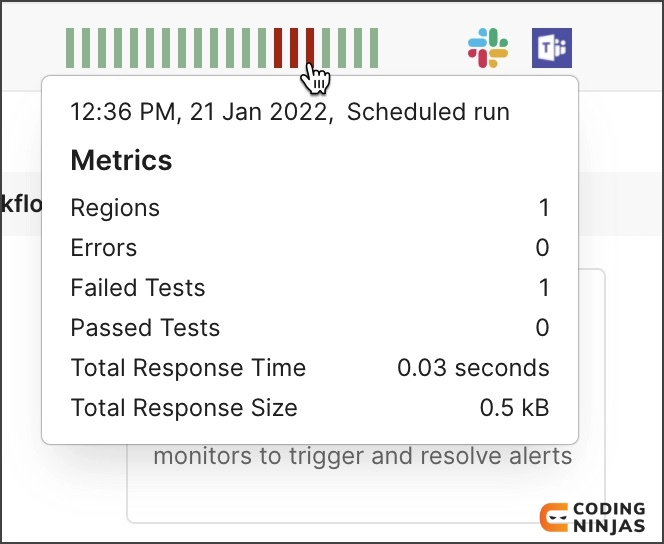
🌞To examine stats for a monitor run, hover your cursor over a bar on the graph.
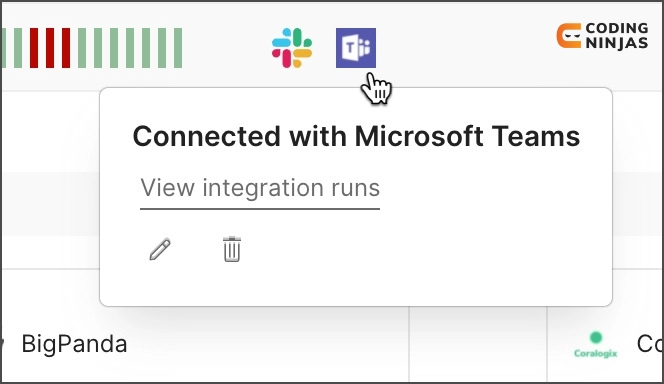
🌞To access information, hover your cursor over an integration's application icon. Choose the Edit icon to make changes to the integration, or choose the Delete icon to remove the integration.
🚀Viewing New Relic Metrics
An application performance management (APM) tool called New Relic can track real-time and historical data for your online apps or business processes in Observing and Viewing an API in Postman. You may obtain New Relic APM metrics using Postman, thanks to the API Builder's New Relic integration.
With this connection, you can connect several New Relic services to a specific version of your API in Postman. There is an API instance for each New Relic service, such as beta, prod1, or prod2. Additionally, you may use Postman to connect several New Relic dashboards to your API.
🚀Connecting to New Relic APM
For each deployment of your API, you must first configure APM services.
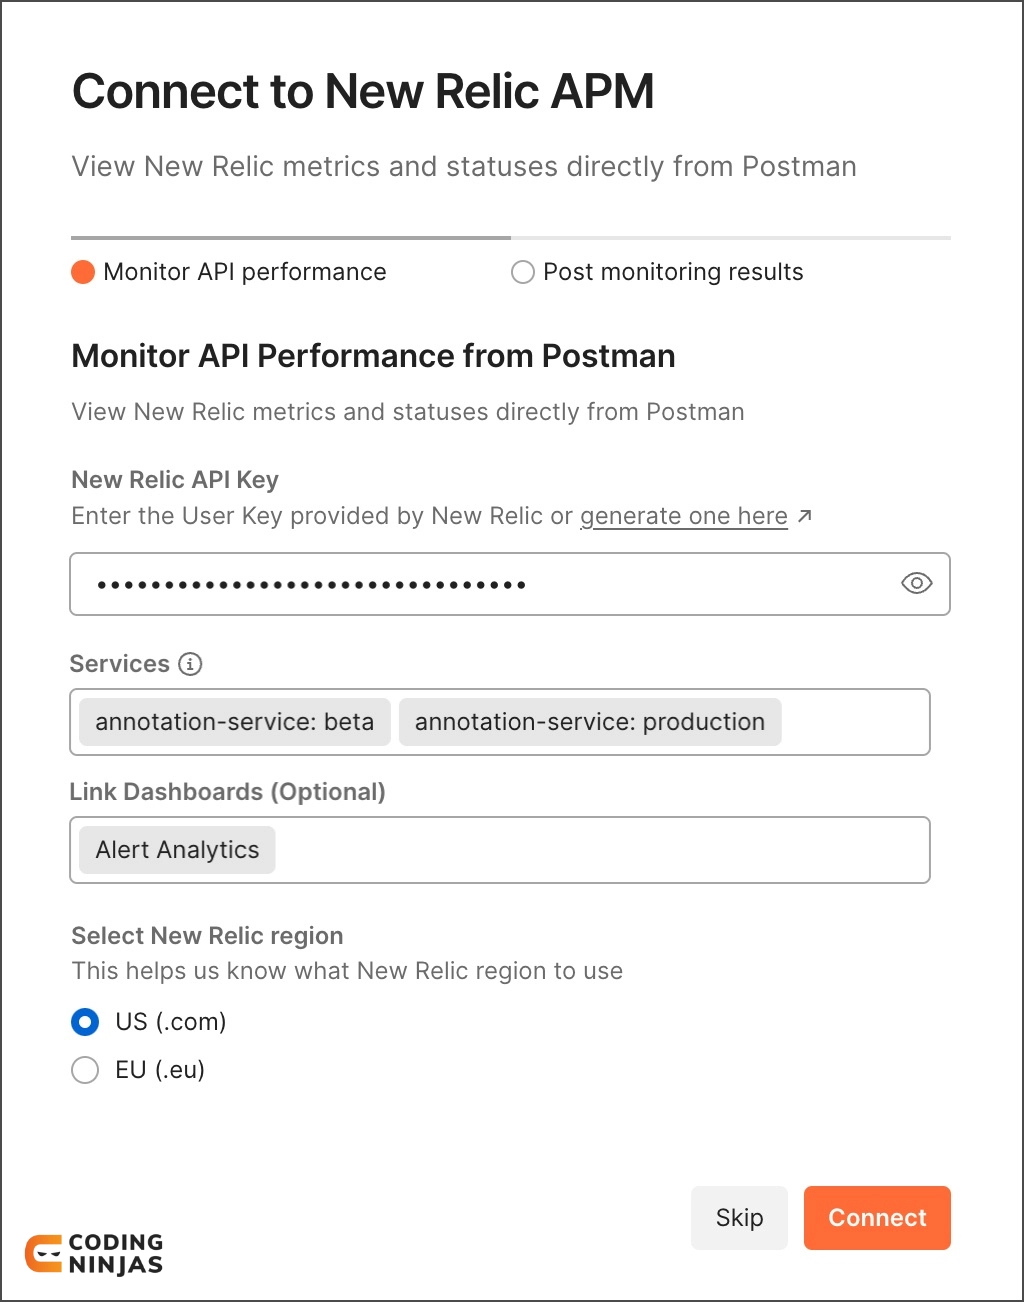
For an API to be linked to New Relic APM:
📌Select the Monitoring tab after opening an API version.
📌Choose New Relic APM from the list of monitoring workflows you may connect Postman to.
📌Key for New Relic here (User Key).
📌To connect to Postman, select one or more New Relic Services.
📌To view in Postman, choose one or more New Relic Dashboards.
📌Decide on the New Relic region (US or EU).
📌Choose Connect.
📌You can also set up an integration to send the results of your Postman monitor runs to New Relic. Enter the integration's specifics here, or choose Maybe Later.
🚀Viewing Datadog metrics
An application performance management (APM) service called Datadog gives cloud-scale applications visibility. You may retrieve Datadog APM metrics using Postman, thanks to the API Builder's Datadog integration.
With this integration, you may connect different Datadog services to a specific version of your API in Postman. Like a web framework or a database, services are the building parts that make up your programme. Additionally, you may use Postman to connect several Datadog dashboards to your API.
🚀Connecting to Datadog APM
You must set up your application such that it sends traces to Datadog before you can start.
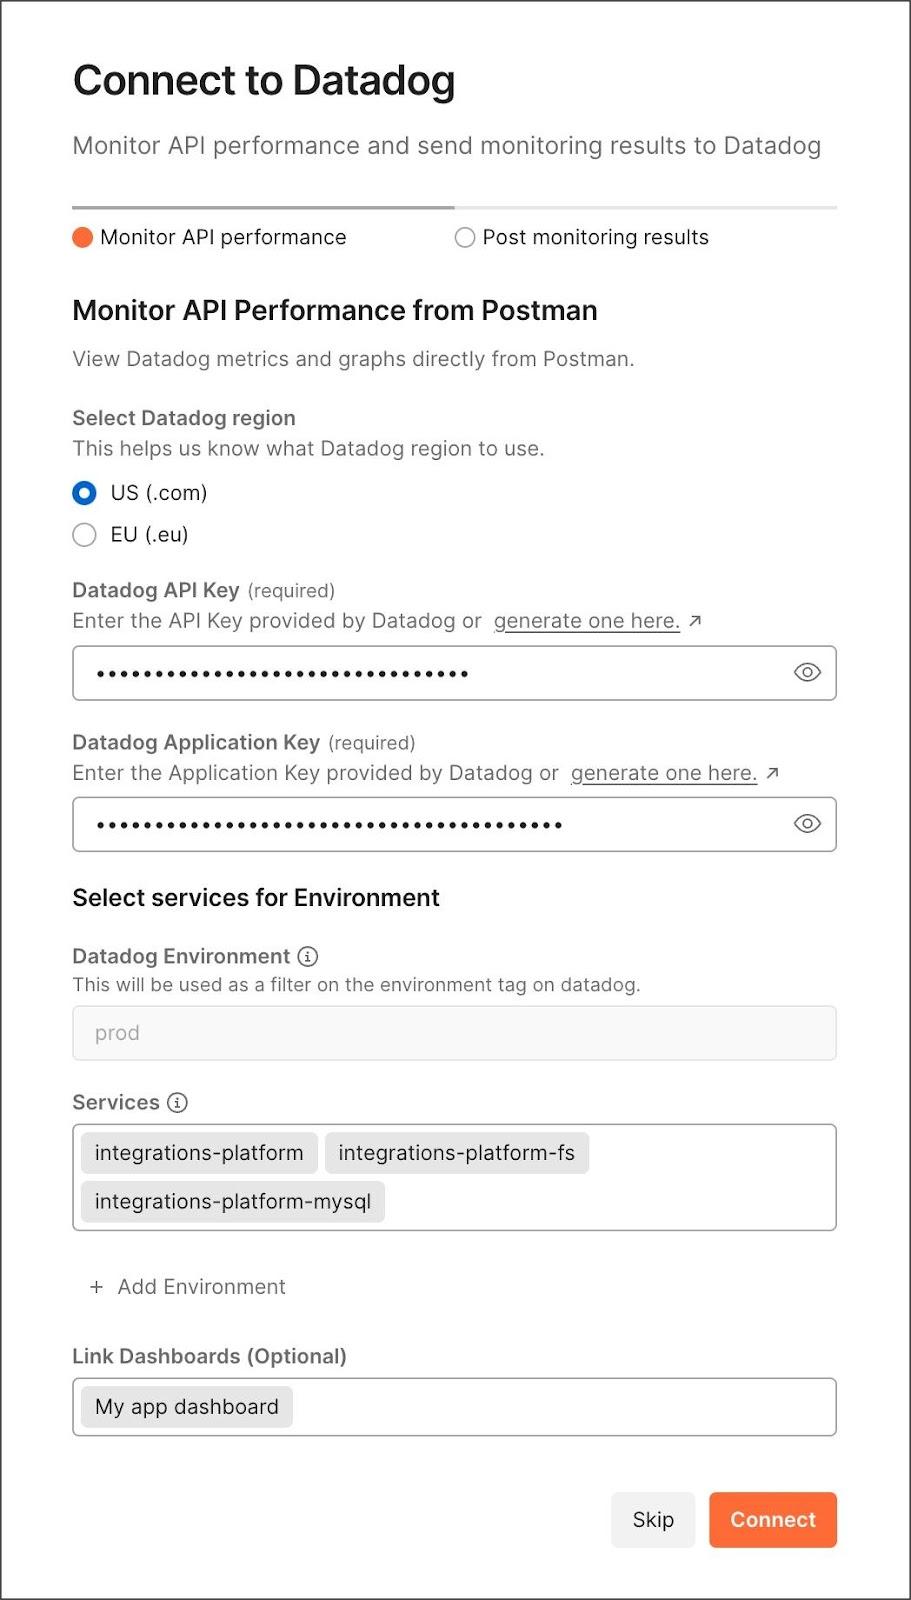
For an API to be linked to Datadog APM:
♟️Open a version of an API, then choose the Monitoring tab.
♟️Choose Datadog under Connect Postman to your monitoring workflows.
♟️Choose a Datadog region (US or EU).
♟️Your Datadog API key and Datadog application key should be entered.
♟️Add the services you want to link into the Datadog Environment (for example, beta or prod).
♟️To connect to Postman, choose one or more Datadog Service
♟️To integrate Datadog Dashboards to Postman, select one or more.
♟️Choose Connect.
Learn Something New in🔟Minutes!
Frequently Asked Questions
What is the purpose of using Postman?
Developers can easily create, share, test, and document APIs with Postman, an API client. Users are given the ability to generate, store, and read both simple and complicated HTTP/s requests as well as their responses to achieve this.
Is Postman a free software to use?
Sending requests and reviewing answers, building and mocking APIs, testing APIs, monitoring APIs, and many other functions are available in the free version too.
What is an “API” Postman?
You may include Postman in your development toolchain by integrating it with the Postman API endpoints. Through the API, you can add and run monitors, update environments, add and run new collections, and update existing collections.
Explain Postman as a testing tool.
An extensive API testing tool that Postman provides makes it simple to put up automated tests. The tests and requests you have made can be combined into a single automated test sequence.
Explain API.
Application Programming Interface(API) is referred to as API. Any application with a specific function is referred to be an application when talking about APIs.
Conclusion
In this article, we have extensively discussed Observing and Viewing an API in postman.
To learn more about Postman, see Web Testing, API Testing, and API.


 8+ registered

