Usage of Orange
The uses of the Orange are shown below:
a) Interactive Data Visualisation:
Orange can be used as a data visualisation tool that helps us to uncover the hidden patterns of the data. The visualisation widgets of the data include the scatter plot for visualising correlations between pairs of attributes, box plot for displaying basic statistics and histogram or other model-specific visualisation like dendrogram, silhouette plot for analysing the result of clustering and tree visualisations for classification of the trees and forests.
b) Visual Programming
Orange can be used as a data mining tool for beginners and expert data scientists. The speciality of the Orange is that it is very simple and easy to use. No laborious coding is required for analysing the data. Thus, it makes it simpler for the interface used to simplify the complex data analytic pipelines.
Features of Orange
We have learned that Orange is a component-based visual programming software package.
Let’s now explore some of the basic features of the Orange:
-
Canvas: It is the visual programming interface for Orange.
-
Widgets: The widgets are nothing but a GUI(Graphical User Interface) element that displays some information. Orange Widgets are building blocks of data analysis. It offers basic functionality such as reading data, showing data tables, comparing learning algorithms, visualising data elements etc.
The different Orange widgets are shown below:
-
Data: widgets for File, data input, filtering, imputing, attributes selecting, sampling, edit domain etc.
-
Model: widgets for Constant, kNN, SVM, Tree, Random Forest, Linear Regression, Logistic Regression, Curve Fit, Neural Network, Stacking etc.
-
Transform: widgets for Select Columns, Select Rows, Merge Data, Transpose, Aggregate Columns, Preprocess etc.
-
Classify: widgets for Naive Bayesian Learner, SVM Learner, Logistic Regression Learner, Majority Learner, Classification Tree Learner etc.
-
Evaluate: widgets for Confusion Matrix, ROC Analysis, Lift Curve, Test Learners, Predictions.
-
Visualise: widgets for scatter plot, Distributions, linear projection, mosaic display, sieve diagram etc.
-
Regression: widgets for Linear Regression Learner, Mean Learner, Regression Tree Viewer, Regression Tree Learner etc.
-
Unsupervised: widgets for Distance File, Save Distance File, Matrix Transformation, Interaction Graph, Attribute Distance, K-Means Clustering, Distance Map etc.
-
Associate: widgets for Association Rules, Item Sets, Association Rules Filter etc.
-
Survival Analysis: widgets for As Survival Data, Cox regression, Cohorts.
-
Bioinformatics: widgets for Databases Update, Genes, Marker Genes, Cluster Analysis etc.
-
Single Cell: widgets for Load Data, Single Cell Databases, Filter, Dot Matrix etc.
-
Spectroscopy: widgets for Spectra, HyperSpectra, Interpolate, Tile file, SNR, Spectral Series, Peak Fit etc.
-
Networks: widgets for Network File, Network Generator, Network Analysis, Single Mode, Save Network etc.
-
Geo: widgets for Geocoding, Geo Map, Geo Transform etc.
-
Text Mining: widgets for Corpus, The Guardian, Sentiment Analysis, Similarity Hashing, Statistics.
-
Image Analytics: widgets for Import Image, Image Viewer, Image Embedding, Save Images.
-
Educational: widgets for Google Sheets, Pie Chart, Random Data, Gradient Descent etc.
- Time Series: widgets for Yahoo Finance, Moving Transform, Line Chart, Correlogram, Spiralogram, VAR Model, Time Slice etc.
Orange Data Mining
In this section, we will be discussing how to use Orange as a data mining tool.
The term Data Mining refers to analysing a large amount of information to discern trends and patterns.
The Orange core objects and Python modules incorporate numerous data mining tasks. The operating principle of Orange is to cover techniques and perspectives in data mining and machine learning.
Orange Widgets
The basics of the Orange Widget have already been defined in the earlier section. Here we will only discuss how it will be used in data mining.
As we saw before, the Orange Widgets are nothing but an element of a GUI(Graphical User Interface) that displays some information. The widgets are regarded as data mining units. They incorporate different types of widgets for performing various tasks.
The widgets communicate with each other by tokens passed from the sender to the receiver through communication channels.
A sample workflow of the Orange widgets is shown below,
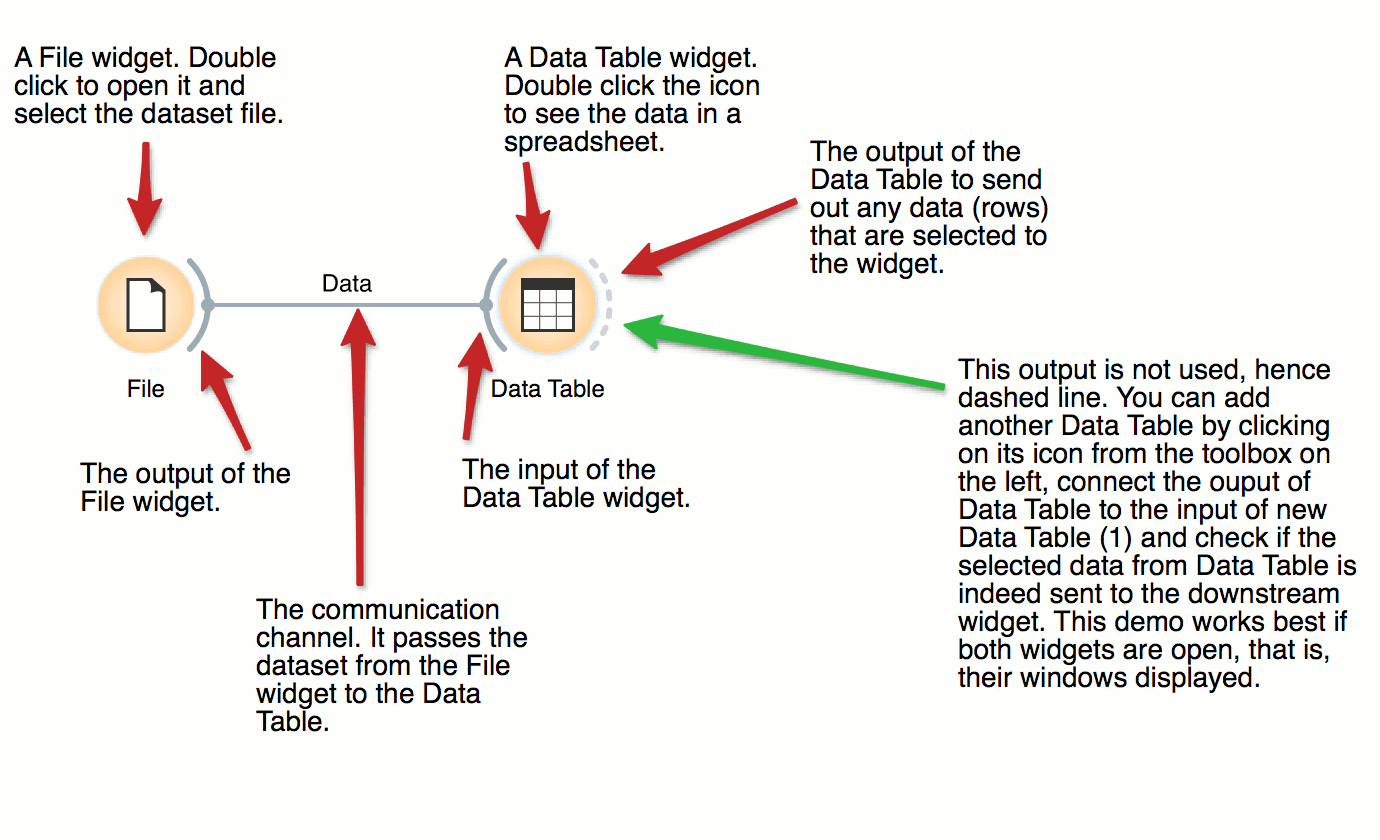
Source
Orange Scripting
To access the Orange object, we need to write our components and design our test schemes through the script. Orange uses Python Script as a scripting language with a clear and powerful syntax and many additional libraries.
Frequently Asked Questions
What is an Orange?
Orange is an open-source data visualisation, data mining and machine learning software.
What do you mean by the term data mining?
Data mining is the process to analyse a large amount of information to discern trends and patterns.
What do you mean by the Widgets?
A widget is an element of a Graphical User Interface(GUI) that displays some information.
What are the widgets available in Orange?
There are a lot of widgets available in Orange which can be grouped into classes according to their function like some of the data widgets are data input, data filtering, imputing etc.
Conclusion
In this article, we have extensively discussed Orange.
We started with the basic introduction, then we discussed,
- What Orange is
- Usage of Orange
- Different Features
-
And finally discussed the data mining tools.
We hope that this blog has helped you enhance your knowledge regarding Orange and if you would like to learn more, check out our articles on Data Mining, Data Analysis Introduction, Data Mining and Data Analytics and Data Wrangling. Do upvote our blog to help other ninjas grow.
Check out this problem - Largest Rectangle in Histogram
Head over to our practice platform Coding Ninjas Studio to practice top problems, attempt mock tests, read interview experiences, follow our guided paths, and crack product based companies Interview Bundle.
Happy Reading!


 9+ registered

