Get a skill gap analysis, personalised roadmap, and AI-powered resume optimisation.
Introduction
In the world of Data Mining, Outlier Detection stands out as a powerful tool that can greatly impact the decision-making process, thus resulting in growth and improved performance.
In this article, we will discuss the different methods of Outlier Detection in Data Mining, along with their application and challenges.
Outliers are data points in data mining that differ in properties and behaviour from the rest of the dataset. These points depict values that are either unusually high or lower than the rest of the data. Hence outliers play a major role in statistical analysis and predictive modelling. They help identify patterns, data corruption, rare events, and errors in the data.
Outlier Detection is a fundamental task in data mining that involves finding these data points from the original dataset. Detecting outliers is important as it helps ensure the data is reliable and accurate.
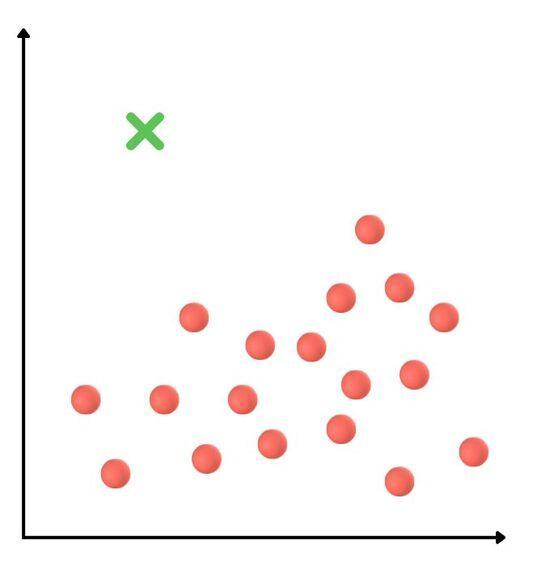
Global outliers, also called point outliers, are the simplest type of outliers. They occur when a data point is very different from all the other data points in a dataset.
Measurement mistakes, wrong data entry, etc usually cause these outliers. Detecting these outliers helps us find and fix these unusual data points.
Collective Outliers
Collective outliers are a group of data points that behave differently from the rest of the dataset. Individually, these points might not be considered outliers, but when you look at them together in a group, they show abnormal behaviour compared to the rest of the dataset.
Contextual Outliers
Contextual outliers, also known as conditional outliers, are data points that stand out from the rest of the data but under specific conditions. That is, these outliers become abnormal under certain settings.
For example, a temperature reading of 45 degrees Celsius might be an outlier during the rainy season but not during the summer season.
Methods of Outlier Detection in Data Mining
There are different methods of Outlier Detection in Data Mining. Let us understand each of them one by one.
Box Plots
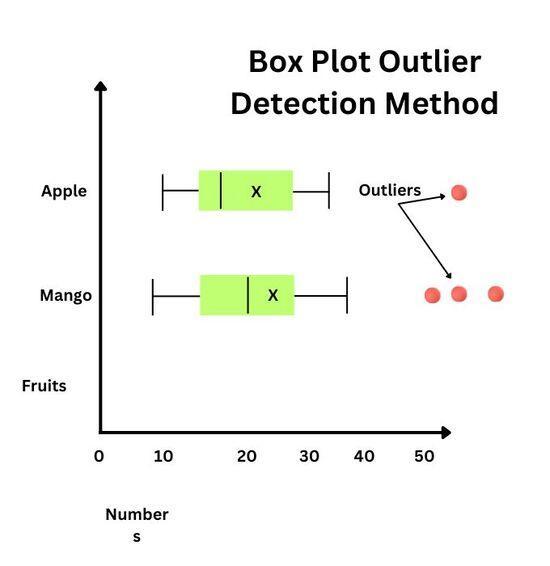
The Box plot method, also known as the box-and-whiskers plots, is a graphical tool used in data mining to detect outliers in a dataset. It visually represents the spread of data and marks the outliers.
The box plot looks like a rectangle box, and it shows the middle 50% of the data.
The line inside the box is a median which is the middle value.
The whiskers extend from the box to the smallest and largest data points that are not outliers.
To find outliers, we look for points outside the whiskers. If a point is far away from the box, greater than 1.5 times the range of the middle 50% of the data, it is considered an outlier.
The outliers are shown as dots on the plot marked with different colors.
Clustering Based Method
Clustering-based methods in outliers detection work by grouping data points into groups based on similarities. After clustering, the algorithms analyze those data points that do not belong to any of the clusters formed. Thus these data points that stand out from the cluster patterns are marked as outliers.
IQR method
The IQR method is a common way to find outliers in data mining. It calculates the range between 75th and 25th percentiles of the data. Any data point that is lower than the 25th percentile or higher than the 75th percentile is considered outliers. These outliers are different from most of the data.
Data that lie below Q1 - 1.5 * IQR or above Q3 + 1.5 * IQR are considered outliers.
Z-Score Method
The Z-Score method measures how far a data point is from the mean in terms of how spread out the data is. It is calculated as the difference between the data point and the mean divided by the standard deviation.
If the z-score of a data point is higher than a certain value (like 2.5 or 3), it can be considered an outlier.
Distance from the Mean Method
The distance from the mean method is a different way to detect outliers in a dataset having many characteristics. It works by measuring how far each data point is from the average of all data points. If the data point is very far from the mean, it is considered an outlier.
Grid Based Method
The grid-based method in outlier detection involves dividing the data space into a grid or many cells. Here Each cell contains a group of data points. The density and the number of data points in each cell are noted. The cells with low data point density are identified as outliers. The data points in these cells may not be related to the rest of the data points.
Applications of Outlier Detection
Outlier Detection in Data Mining has many uses in different fields. Some of them are:
Outlier detection is used in the finance and banking industry to spot any frauds or malpractices.
Outlier analysis is also used to spot any fraudulent activities in the telecom industry. It helps identify abnormal call record patterns, phone cloning, SIM card misuse, etc.
In the medical industry, outlier detection is used to identify abnormal medical conditions or errors in medical data. This might include errors in ECG readings, blood test results, medical images, etc.
Marketers also use outlier detection to study customer behaviors.
Outlier Detection is applied in network security by identifying any abnormal trends in the network, thus helping to detect malware attacks or other Cyber security threats.
The manufacturing industry also uses outlier detection to find faults in products.
Challenges of Outlier Detection in Data Mining
Outlier Detection in Data Mining is a tough task with many challenges, such as:
Outliers are different from noise, and the presence of noise can greatly affect the accuracy of outlier detection methods resulting in errors.
Detecting outliers in datasets with many attributes can be difficult. Here the old methods may not work well, and hence advanced features and software are needed.
Choosing the right method for outlier detection can be really tricky. Different methods work differently with different types of data.
Frequently Asked Questions
What do you understand by Outliers in Data Mining?
Outliers are data points in data mining that differ in properties and behavior from the rest of the dataset. These points depict values that are either unusually high or lower than the rest of the data.
What are the different methods of Outlier Detection in Data Mining?
Different methods of Outlier Detection in Data Mining include Box Plots, IQR method, Z-Score Method, Distance from the Mean Method, Proximity Based Method, Grid Based Method, and Clustering Based Method.
What is the Box plot method of Outlier Detection in Data Mining?
The Box plot method, also known as the box-and-whiskers plots, is a graphical tool used in data mining to detect outliers in a dataset. It visually represents the spread of data and marks the outliers.
Mention some applications of Outlier Detection in Data Mining.
Outlier detection is used in the finance, banking, telecom, and network security industry to detect fraud. It is also used in the medical industry to detect abnormal medical conditions and errors in medical readings and logs.
Conclusion
Kudos on finishing this article! We have discussed the different methods of Outlier Detection in Data Mining and how it is used in different industries.
We hope this blog has helped you enhance your knowledge of Outlier detection.
Keep learning! We suggest you read some of our other articles related to Data Mining:
But suppose you are just a beginner and are looking for questions from tech giants like Amazon, Microsoft, Uber, etc. For placement preparations, you must look at the problems, interview experiences, and interview bundles.


 9+ registered

