


Introduction
Virtual machines and other computing resources require agents that collect the monitoring data needed to measure the performance and availability of guest operating systems and workloads. Today, there are many legacy agents for this purpose. Eventually, they will all be replaced by the new Azure Monitor Integration Agent. This article describes the legacy agent and the new Azure Monitor agent.
Overview of Monitoring Agents
The Monitoring Agent is a collected-based daemon that collects system and application metrics from VM(Virtual Machine) instances and sends them to Monitoring. The monitoring agent default collects CPU, disk, network, and process metrics. You can configure the monitoring agent to monitor third-party applications to get a complete list of agent metrics.
In the coming sections, we will see how to install the agent.
Purpose
Using a monitoring agent is optional but recommended. Monitoring can access some instance metrics without a monitoring agent, such as CPU utilization, network traffic, disk traffic metrics, and uptime information. A monitoring agent is used for monitoring and accessing additional system resources and application services for virtual machine (VM) instances. If you need these additional features, install the monitoring agent.
After installing the Monitoring Agent, you can monitor supported third-party applications by adding an application-specific collected configuration. For more information, see Monitoring third-party applications.
To see the compatibility in different environments, please go to Compatibility Check.
Installing the Cloud Monitoring agent
Cloud Monitoring agent can be installed using different methods:
Installing agents on a fleet of VMs using gcloud/Agent Policies
Use the gcloud command line tool to create an Agent Policy that installs and manages agents on your fleet of VMs.
Managing Agent Policies
Agent policies enable automatic installation and maintenance of Google Cloud Operations Suite agents across fleets of VMs that meet user-defined criteria. With a single command, you can create policies for Google Cloud projects that manage existing and new VMs associated with that cloud project, ensuring proper installation of all agents and automatic updates of options.
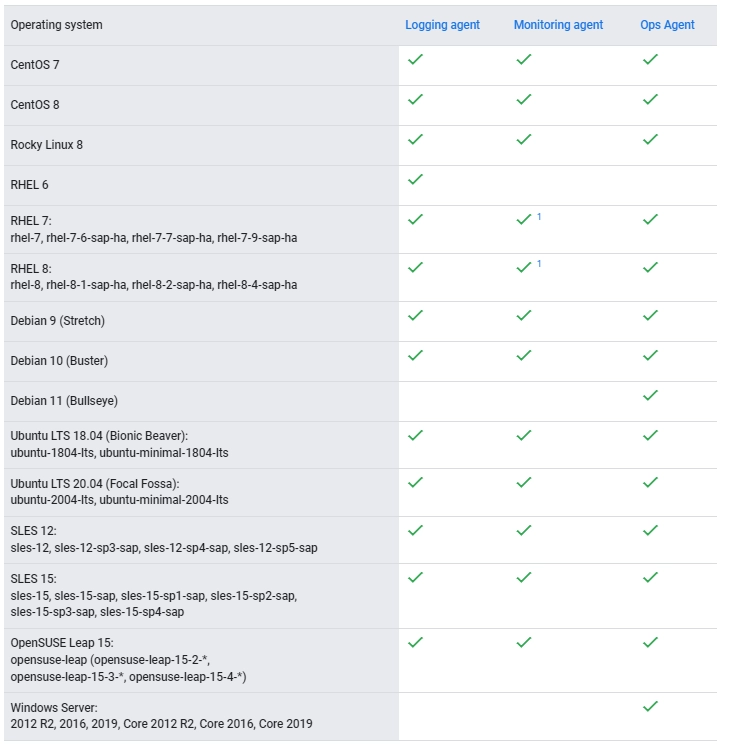
Supported operating systems
You can apply agent policies to Compute Engine instances running the following operating systems:
Logging agents are mapped to policies using agent type logging. Monitoring agents are associated with policies that have agent type metrics. Ops agents are associated with policies of agent type ops-agent.
Creating an Agent Policy
For creating an Agent Policy using the Google Cloud Command Line Interface, complete the below steps:
- If you haven't done so already, Firstly install the Google Cloud CLI, if you haven't done it yet. In the gcloud Command Line Interface, the command group for managing Agent Policies is in beta release.
- Install the beta component of the gcloud Command Line Interface, if you haven't done so already,
gcloud components install beta
To check if beta component is installed, run the following:
gcloud components list
Ensure for the latest version of the beta component(if you have installed it previously)
gcloud components update
By using the following script to enable the APIs and to set the proper permissions for using the Google Cloud CLI:
set-permissions.sh.
3. Create a policy using the gcloud beta compute instance ops-agents policy create command. For command syntax, see the documentation for creating ops-agents policies for gcloud beta computing instances.
For more information on the available gcloud CLI commands and options, see the gcloud beta computing instance ops-agents policy documentation.
Best practices for using Agent Policies
To control the impact on your production system during rollout, we recommend that you use instance labels and zones to filter the instances to which the policy applies.
Let's have a look at an example of a phased rollout plan for CentOS 7 Virtual Machines:
Phase 1: Create a policy to target all Virtual Machines with the label env=test and app=myproduct.
gcloud beta compute instances \
    ops-agents policies create ops-agents-policy-safe-rollout \
    --agent-rules="type=logging,version=current-major,package-state=installed,enable-autoupgrade=true;type=metrics,version=current-major,package-state=installed,enable-autoupgrade=true" \
    --os-types=short-name=cento,version=7 \
    --group-label=env=test,app=myproduct \
    --project=my__project
For detailed information about specifying the OS, visit gcloud beta compute instances ops-agents policies
Phase 2: Update that policy to target env=prod and app=myproduct and only a single zone.
gcloud beta compute instances \
    ops-agents policies update ops-agents-policy-safe-rollout \
    --group-label=env=prod,app=myproduct \
    --zones=us-central1-c \
Phase 3: Update that policy to clear the zones filter so it rolls out globally
gcloud beta compute instances \
    ops-agents policies update ops-agents-policy-safe-rollout \
    --clear-zones
Limitations
For a policy to take effect on virtual machines older than OSConfig, an additional setup is required to ensure that the OSConfig agent on which the policy is based is installed on the VM. Install the OSConfigAgent on the VM fleet by performing the following steps:
- Make sure you have already run the set permissions. sh script in the Creating an Agent Policy.
- Decide on which Virtual Machine you want to install the Operating System Config Agent and list them in a Comma Separated Value(CSV) file.
- To retrieve the list of all the non-Google-managed (e.g. Google App Engine or Google Kubernetes Engine) instances into a CSV, run:
  gcloud compute instances list \
      --filter="-labels.list(show="keys"):goog-" \
      --format="csv(name,zone)" \
      | grep -v -x -F -f <(gcloud compute instances os-inventory list-instances \
          --format="csv(name,zone)") \
      | sed 's/$/,update/' > instances.csv
The grep section excludes VMs that already have the OSConfigAgent installed and enabled. Google-based VM label exclusion excludes Compute Engine VMs managed by GKE, App Engine, and so on. To further filter the instances by
zone or label, change --filter as follows:
"-labels.list(show="keys"):goog- AND zone:(ZONE_1,ZONE_2) AND labels.KEY_1:VALUE_1 AND labels.KEY_2=VALUE_2"
To run a command similar to the following, follow the script's instructions to download and run the mass-install-osconfig-agent.sh script.
bash mass-install-osconfig-agent.sh --project project -id --input-file instance .csv
This script automates the steps to install the OSConfig agent.
Install agents on VM fleets using automation tools: Install and manage agents on VM fleets using automation tools such as Ansible, Chef, Puppet, and Terraform.
Managing agents on multiple VMs
Google Cloud's operations suite provides different ways to manage the Monitoring agent across your fleet of Compute Engine Linux Virtual Machines:
-
Ansible: By using this role, you can install and configure the agent across your fleet of Windows and Linux Virtual Machines. For more and detailed information on configuring the Ops Agent using Ansible, visit the following documentation
- Ansible Role for Cloud Ops documentation.
-
Install Ops Agent to troubleshoot third-party applications walk through the above video for deploying and configuring the Ops Agent.
-
Chef: Using this cookbook, you can install and configure the agent across your Windows and Linux Virtual Machines fleet.
-
Puppet: By using this module, you can install and configure the agent across your fleet of Windows and Linux Virtual Machines.
-
Terraform: By using this module, you can install and configure the agent on Virtual Machines with supported operating systems. For more information, visit Terraform Agent Policy documentation.
- Agent Policy using gcloud CLI: You can use the Google Cloud CLI to create agent policies that manage new and existing virtual machines running supported operating systems to ensure proper installation of all agents and automatic options updates. For more information, see the Operations Suite Agent Policy Management Solution documentation.
Installing the Cloud Monitoring agent on Individual VMs
Key point: While this agent will continue to be supported, we recommend that you use the Ops Agent for new workloads and eventually migrate your existing VMs to use the new agent. Ops Agent is the ultimate replacement for existing agents in Google Cloud's Operations suite, providing a simple user experience with metrics and login to a single agent.
The Cloud Monitoring agent collects system and application metrics from the VM instance and sends them to Monitoring. You can configure the monitoring agent to monitor third-party applications as well.
This guide describes how to install a cloud monitoring agent for monitoring on Compute Engine and Amazon Elastic Compute Cloud (EC2) VMs. Using an agent is optional but recommended for ComputeEngine VM instances. For these VMs, the monitor can access metrics from the VM's hypervisor, such as CPU utilization, network traffic, disk traffic metrics, and uptime, without an agent. You must use an agent for Amazon Elastic Compute Cloud (EC2) VMs.
On instances running Microsoft Windows, memory, paging file, the agent records CPU and volume usage. By default, if you are running IIS or SQL Server, the agent collects metrics from these services.
Note: Cloud Monitoring agents are designed to capture system, third-party, custom, and agent telemetry metrics. Some of these indicators are charged. For pricing information, see Monitoring pricing.
Before you begin
To install the agent, ensure that you have the following:
- A supported VM instance in a Google Cloud project or Amazon Web Services (AWS) account.
A minimum of 250 MiB of resident (RSS) memory is recommended to run the Monitoring agent.
Also, ensure your VM is running a supported operating system.
-
Credentials for VM instances that allow communication with Cloud Logging or Cloud Monitoring. Compute Engine VM instances usually have the correct credentials by default. If any of the following scenarios apply, you may not have the correct credentials and must complete the steps to approve the monitoring agent.
- Running AWS EC2 VM instances, you must install authorization credentials on your VMs before installing the agent.
- Running very old Compute Engine instances or Compute Engine instances created without the default credentials.
To check if you have the proper credentials, run the Verifying Compute Engine credentials procedures.
- For AWS users, do the following:
- Connect your AWS account to a Google Cloud. For information about this process, see Viewing metrics for AWS accounts
- Refer to the “Google Cloud projects for AWS EC2 VM instances” section for additional information.
- For pricing information, go to Pricing for Google Cloud's operations suite.
- If you're using VMs that don't have access to remote package repositories, refer to the VMs without remote package access section for more information.
Installing the agent using the command line
To install the agent using the command line, use the following instructions.
Installing the latest version of the agent
For the installation of the latest version agent, complete the following steps.
Windows
Connect to your instance using RDP or a similar tool and log in to Windows.
Right-click the PowerShell icon and select Run as administrator to open a PowerShell terminal with administrator privileges.
Run the following PowerShell commands:
(New-Object Net.WebClient).DownloadFile("https://repo.stackdriver.com/windows/StackdriverMonitoring-GCM-46.exe", "${env:UserProfile}\StackdriverMonitoring-GCM-46.exe")
& "${env:UserProfile}\StackdriverMonitoring-GCM-46.exe"
Installing a specific version of the agent
To install a specific version of the agent, follow these steps: Connect to the instance using
RDP or a similar tool and log in to Windows.
Right-click the PowerShell icon and select Run as administrator to open a PowerShell terminal with administrator privileges.
Run the following PowerShell commands:
(New-Object Net.WebClient).DownloadFile("https://repo.stackdriver.com/windows/StackdriverMonitoring-GCM-46.exe", "${env:UserProfile}\StackdriverMonitoring-GCM-46.exe")
& "${env:UserProfile}\StackdriverMonitoring-GCM-46.exe"
Alternatively, you can browse to the following URL to download and run the agent's installer:
https://repo.stackdriver.com/windows/StackdriverMonitoring-GCM-46.exe
To install the agent silently, append the /S option to the invocation of the installer:
& "${env:UserProfile}\StackdriverMonitoring-GCM-46.exe" /S
In “silent” mode use the /D option to specify the installation directory, for example:
& "${env:UserProfile}\StackdriverMonitoring-GCM-46.exe" /S /D="C:\Stackdriver\Monitoring\"
You can delete the installer when it completes successfully.
If you have trouble with the installation, refer to the Troubleshooting page.
For the LINUX installation, please visit this page.
Installing the agent using the Google Cloud console
You can install the agent on one or more than one Compute Engine Virtual Machines from the pre-configured Monitoring Virtual Machine Instances dashboard.
To reach this dashboard, do the following:
- In the console, select the Google Cloud project.
- Go to console
- In the navigation pane, select Monitoring.
- Select Dashboards in the Monitoring navigation pane
- In the table of dashboards, locate the Virtual Machine Instances entry, and click on the name.
The Inventory tab on the VM Instances dashboard lists all VMs and includes a status column for your agent, as shown in the following screenshot:
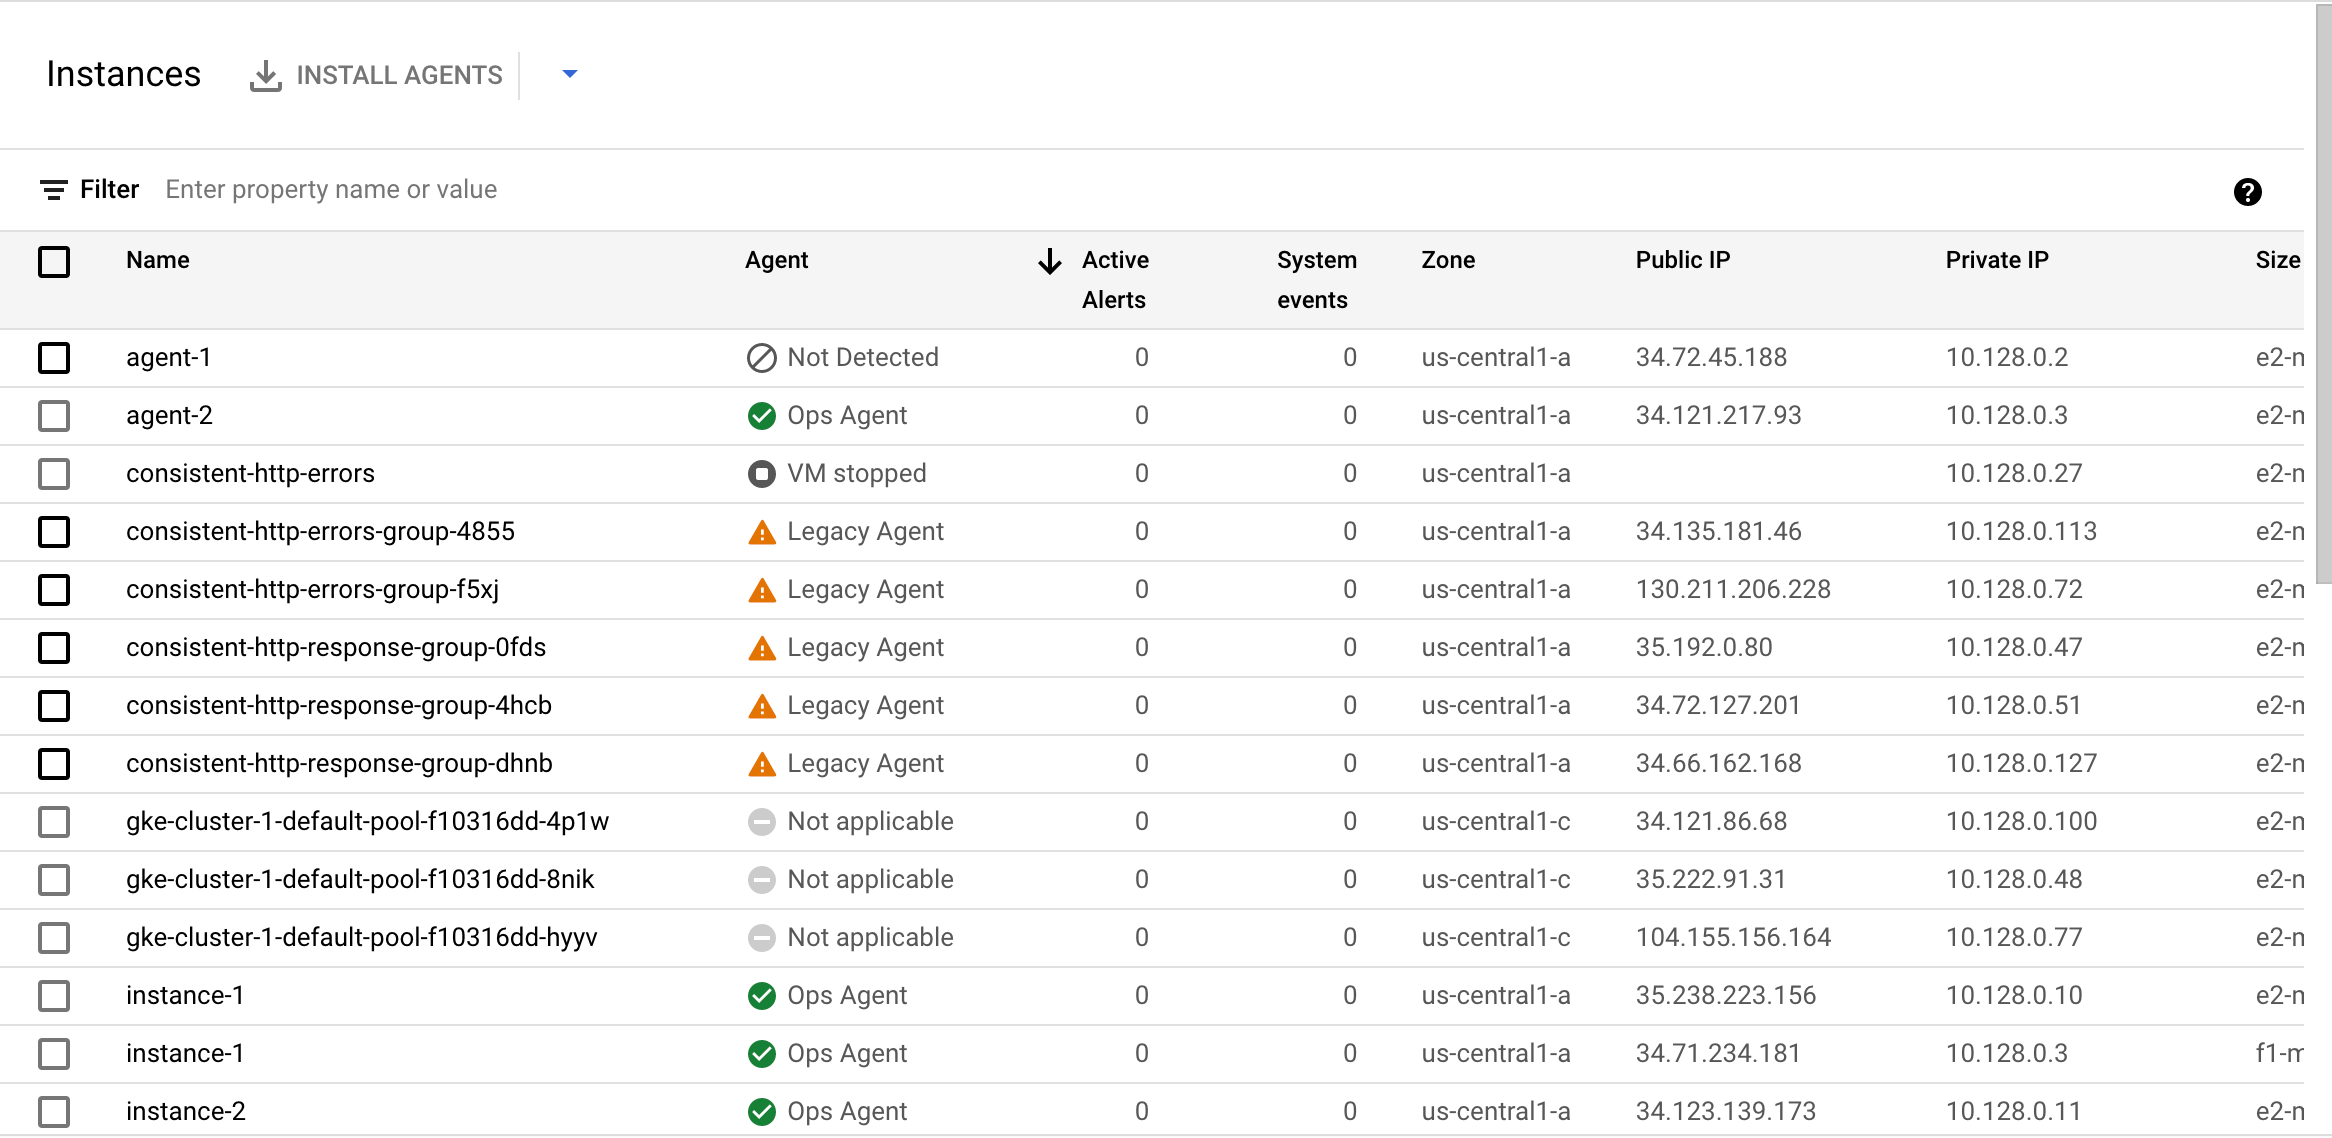
The Agent column reports the following values:
-
Not detected: You don't have an agent installed. If Cloud Monitoring doesn't detect any agents installed on the Compute Engine instance, then you can install an agent by doing the following:
- Select the VM instances on which you want to install agents.
-
Click the Install agents option on the Instances table, which brings up an installation workflow in the dashboard, and follow the instructions. The Ops Agent is the default installed agent, but the installation workflow provides a link to install the legacy agents.
- The Ops Agent collects both metrics and logs by default. You can change this default behavior by configuring the Ops Agent.
- Ops Agent: You are running the Ops Agent.
- Legacy agent: You are running the legacy Monitoring or the Logging agent. See Migrating from the legacy agents to the Ops Agent for information on transitioning to the Ops Agent.
- Not applicable: This Virtual Machine is not a supported platform for running the agent.
- VM stopped: The agent's status is unknown as the VM is not running.


 9+ registered

